

Question: We will use the Bricks data from aus _ product ion ( Australian quarterly clay brick production 1 9 5 6 - 2 0 0
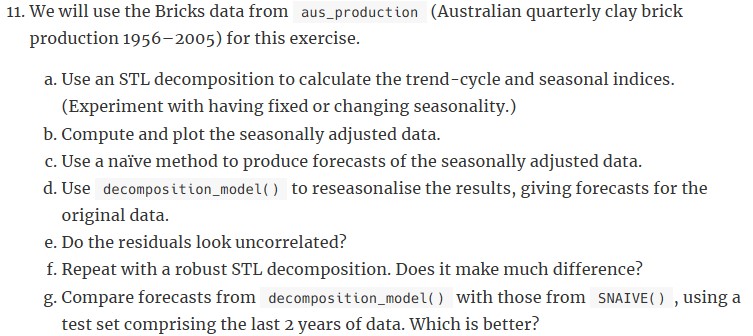
We will use the Bricks data from ausproduct ion Australian quarterly clay brick
production for this exercise.
a Use an STL decomposition to calculate the trendcycle and seasonal indices.
Experiment with having fixed or changing seasonality.
b Compute and plot the seasonally adjusted data.
c Use a nave method to produce forecasts of the seasonally adjusted data.
d Use decompositionmodel to reseasonalise the results, giving forecasts for the
original data.
e Do the residuals look uncorrelated?
f Repeat with a robust STL decomposition. Does it make much difference?
g Compare forecasts from decompositionmodel with those from SNAIVE using a
test set comprising the last years of data. Which is better?
Step by Step Solution
There are 3 Steps involved in it
1 Expert Approved Answer
Step: 1 Unlock

Question Has Been Solved by an Expert!
Get step-by-step solutions from verified subject matter experts
Step: 2 Unlock
Step: 3 Unlock