

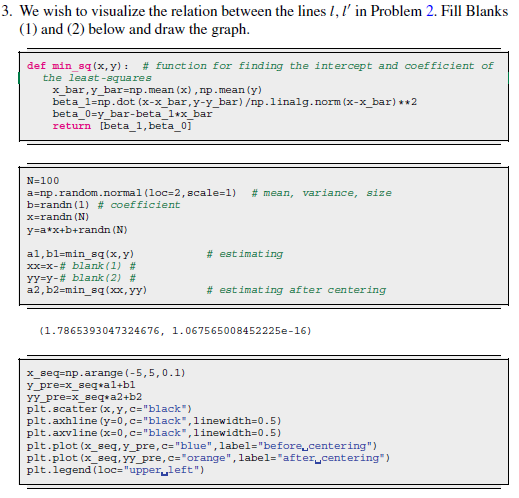
Question: We wish to visualize the relation between the lines l , l ' in Problem 2 . Fill Blanks ( 1 ) and ( 2
We wish to visualize the relation between the lines in Problem Fill Blanks
and below and draw the graph.
def minsqxy: # function for finding the intercept and coefficient of
the leastsquares
xbar,ybarnpmean xnpmeany
betalnpdot xxbar,yybarnplinalg.norm xxbar
betaybarbetaxbar
return betabeta
N
anprandom.normallocscale # mean, variance, size
brandn # coefficient
xrandn N
yaxbrandnN
alblminsqxy # estimating
xxxx# blangk #
yYy# blank #
abminsqxxxyy # estimating after centering
e
xseqnparange
yprexseqab
yYprexseqab
pltscatterxyc"black"
pltaxhline yc"black", inewidth
pltaxvline xc"black", linewidth
pltplotxseq,ypre,c"blue", label"beforecentering"
pltplot xseq, yypre, c"orange", label"aftercentering"
pltlegendoc"upper,left"
Step by Step Solution
There are 3 Steps involved in it
1 Expert Approved Answer
Step: 1 Unlock

Question Has Been Solved by an Expert!
Get step-by-step solutions from verified subject matter experts
Step: 2 Unlock
Step: 3 Unlock