

Question: @ webassign.net W) MATH 1130, section DO, .. RIS Assignment Submission & Scoring Assignment Submission For this assignment, you submit answers by question parts. The
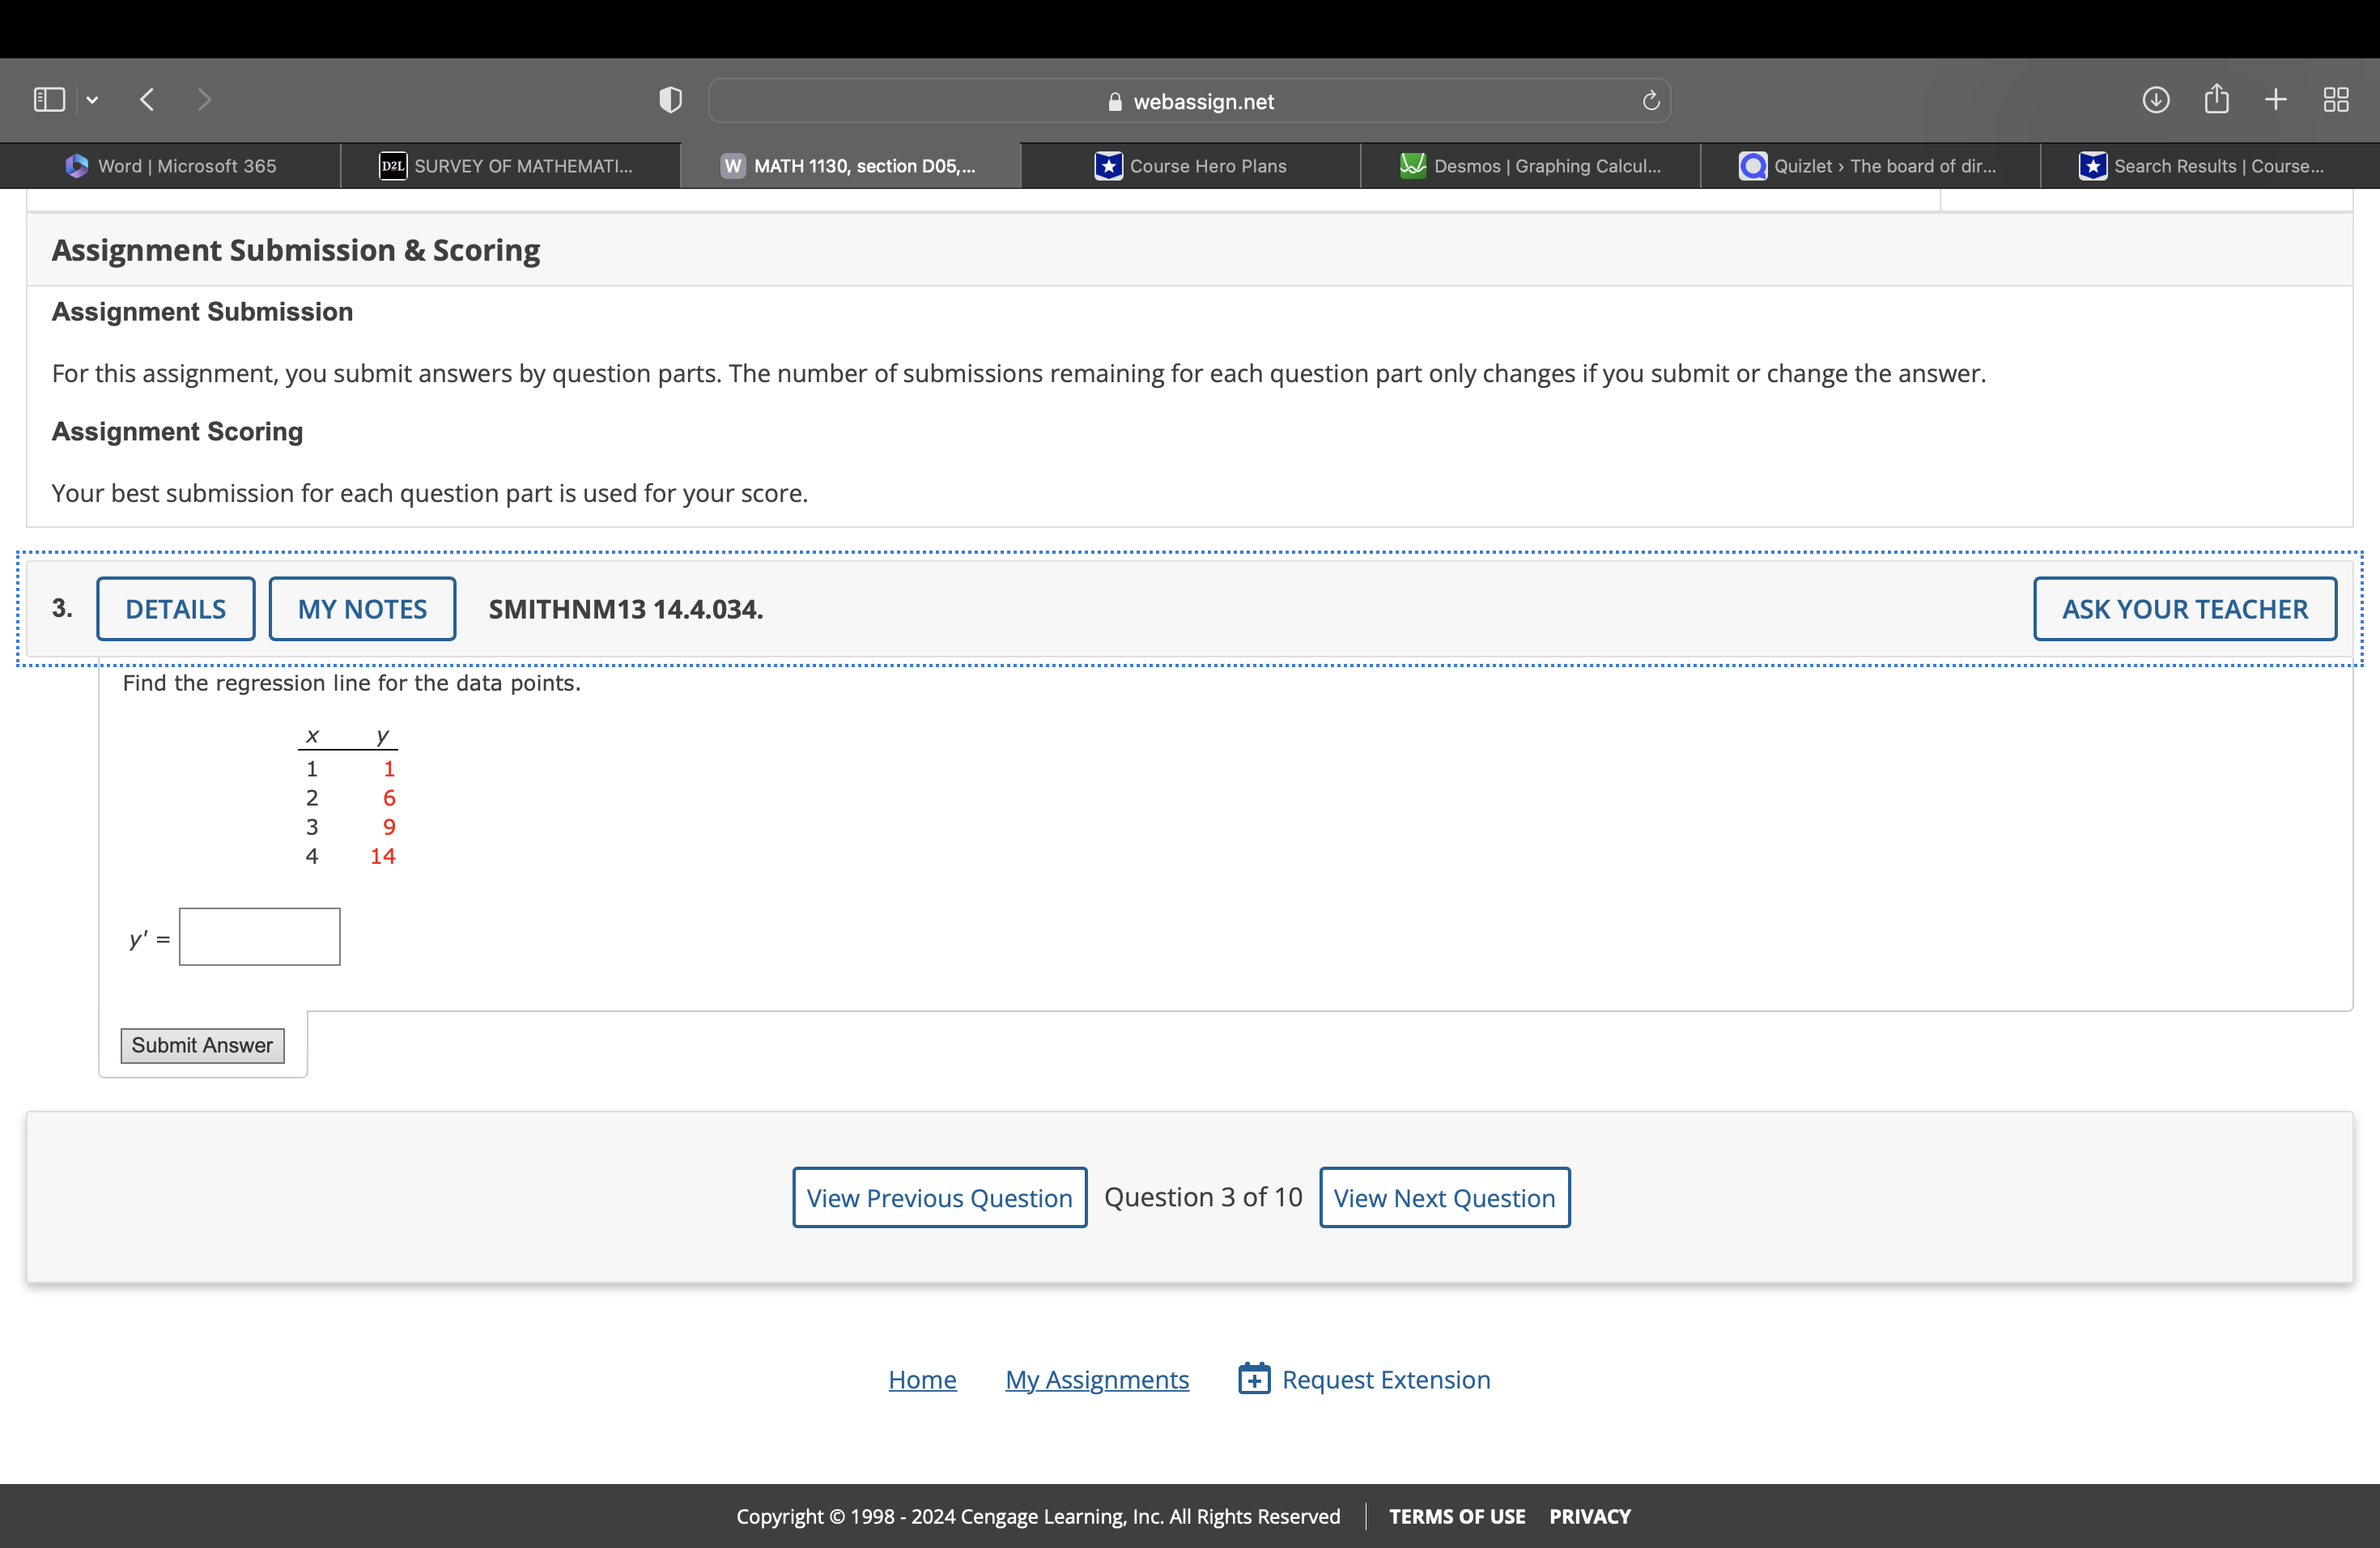
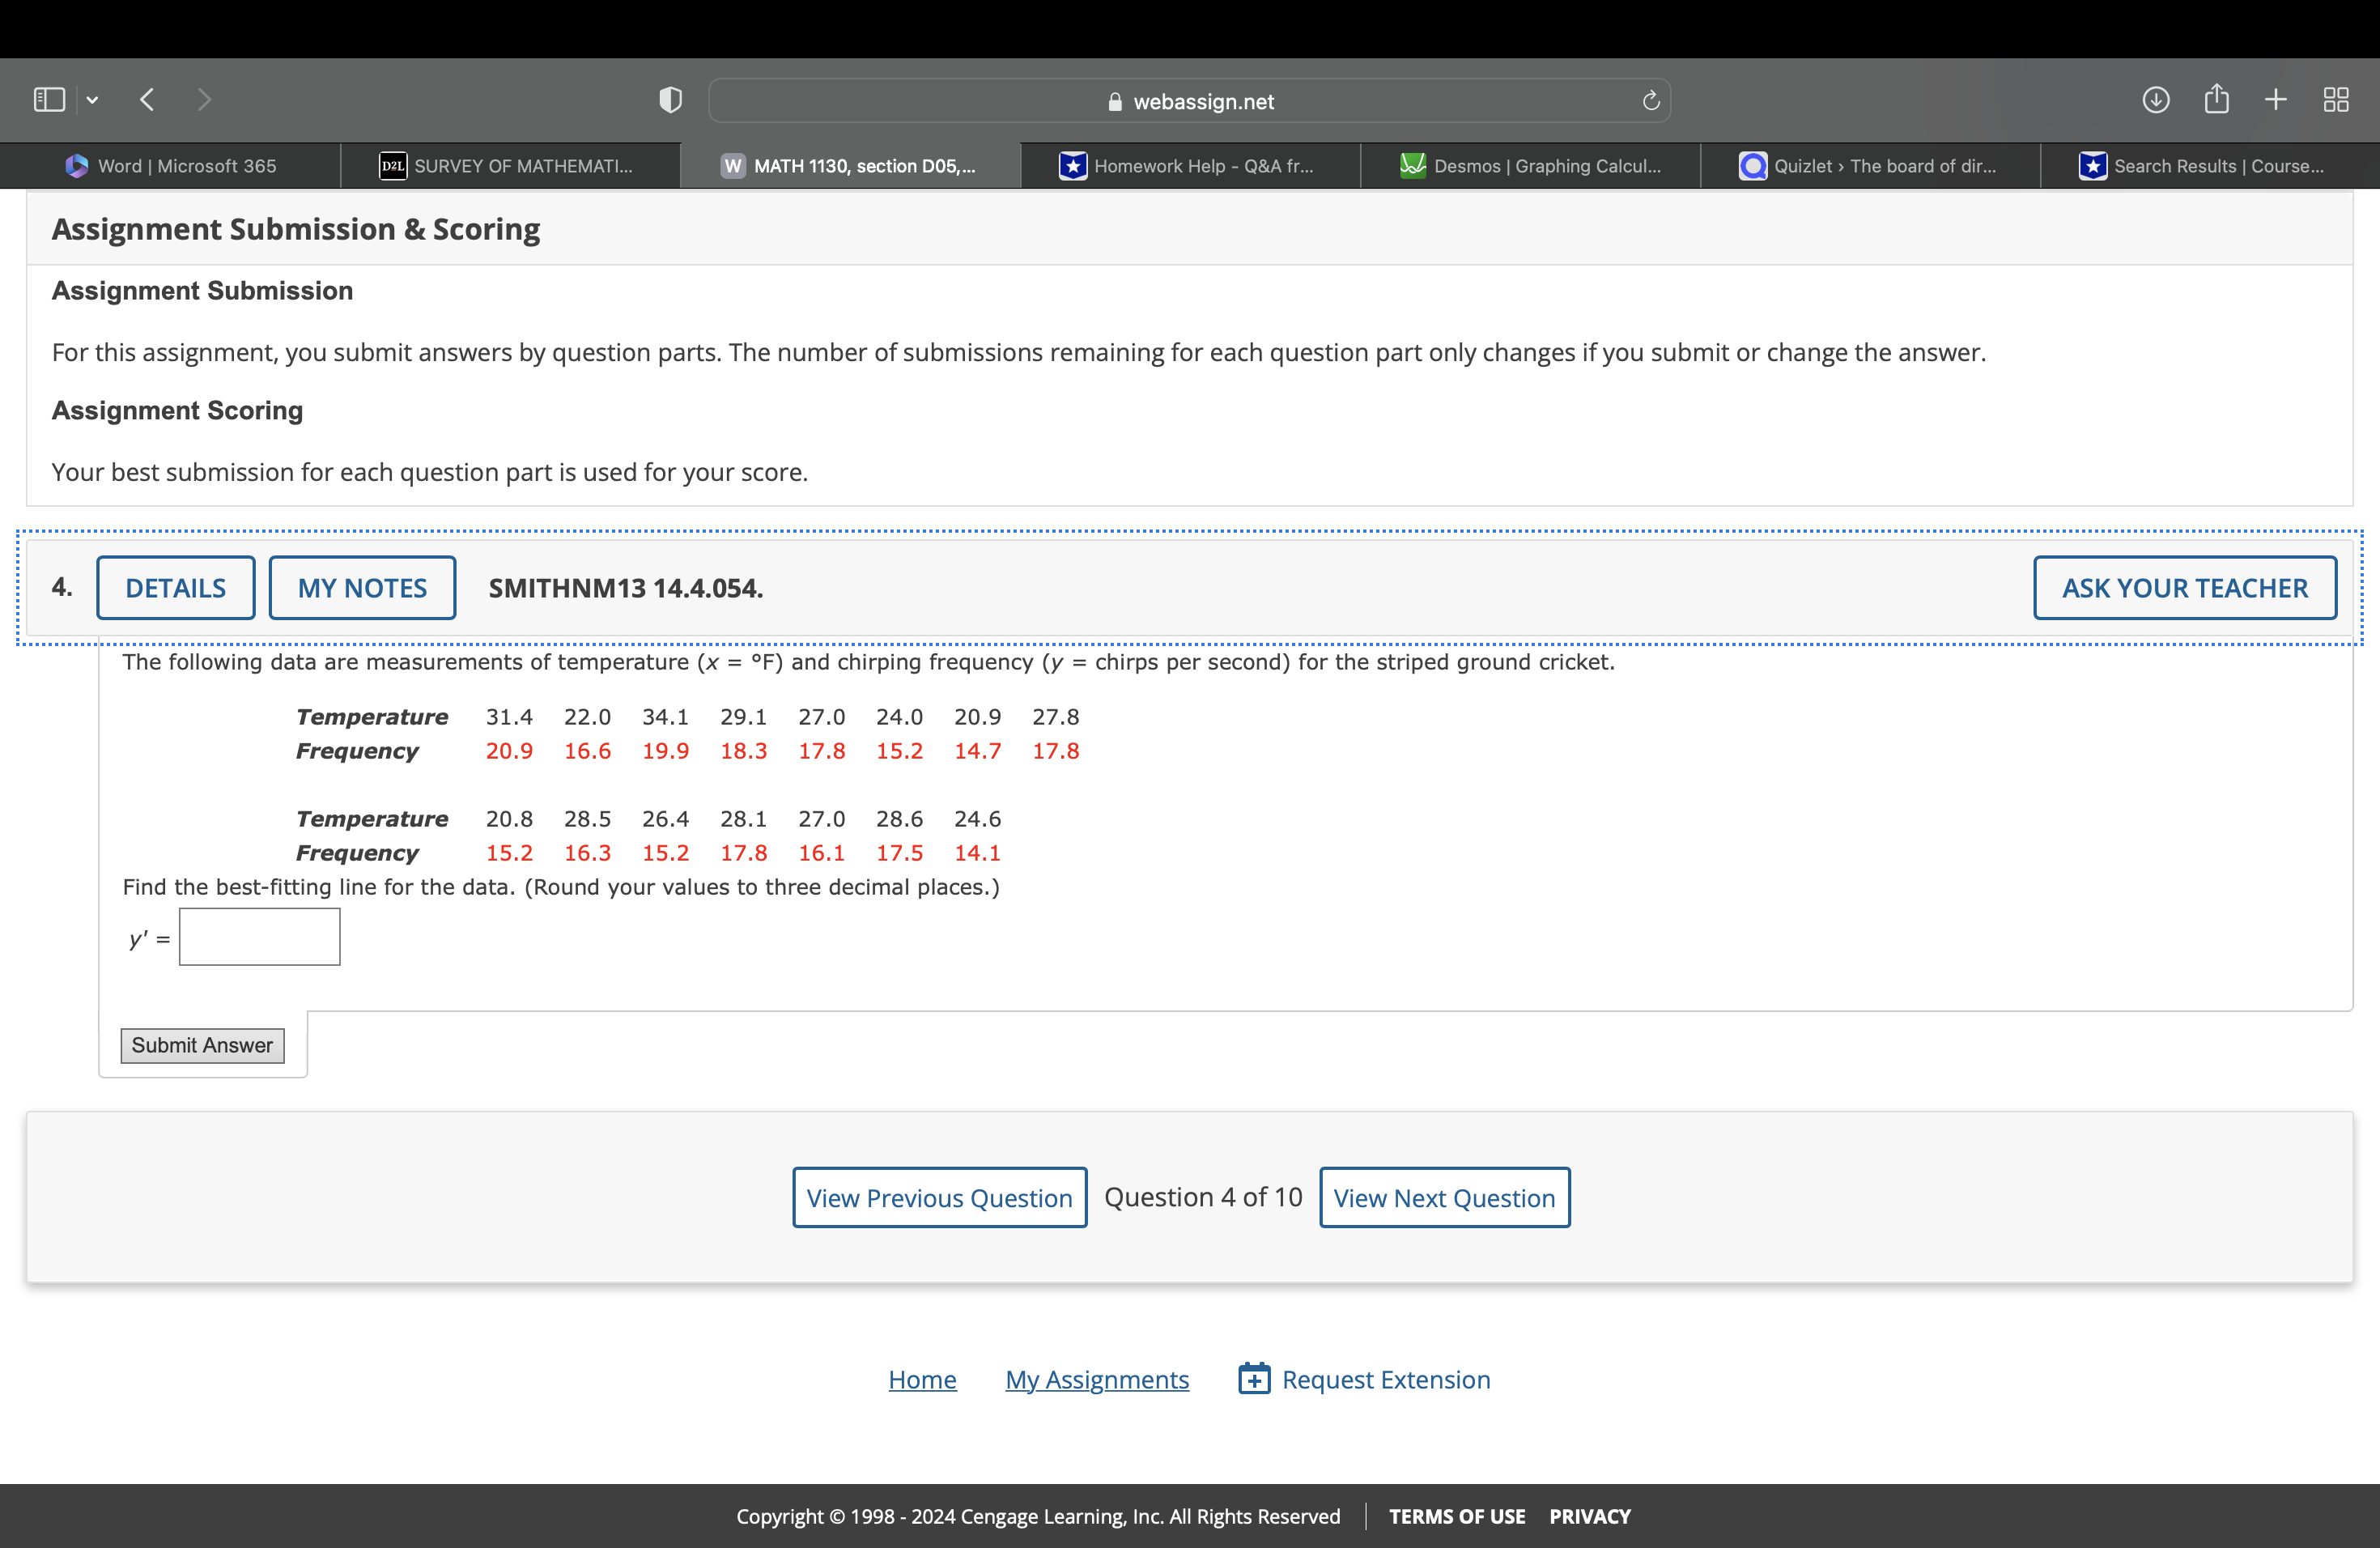
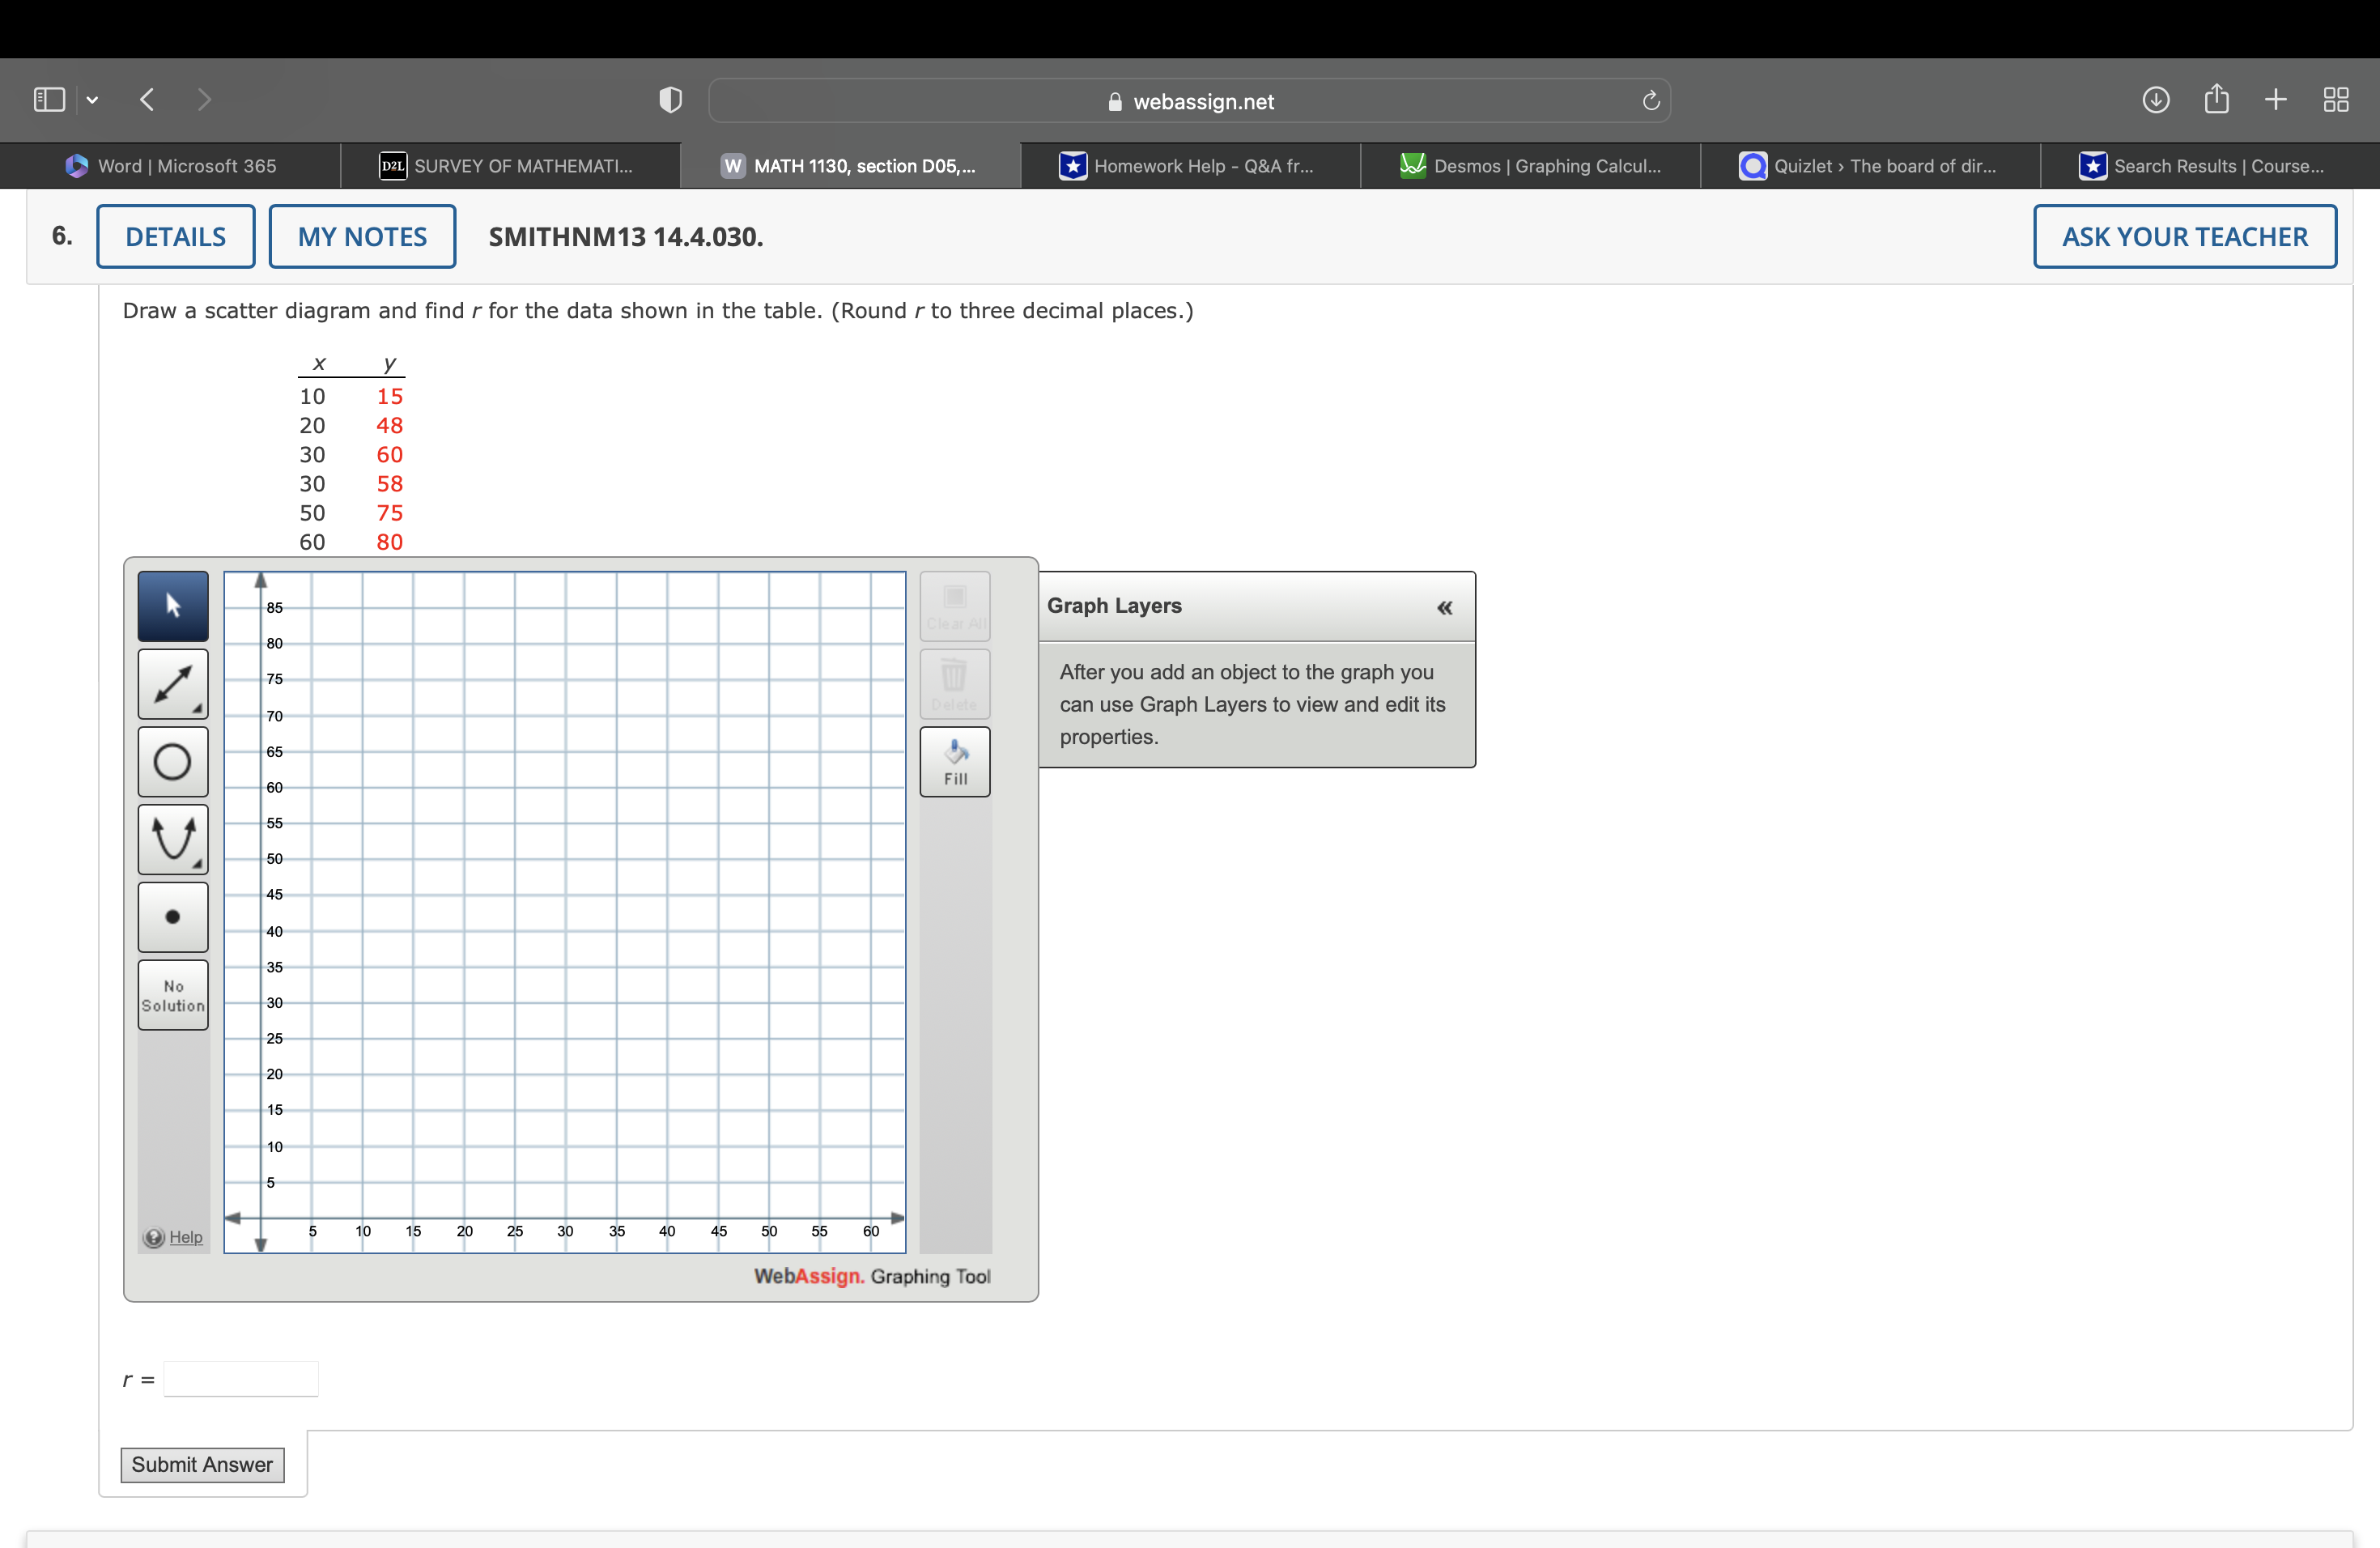
@ webassign.net W) MATH 1130, section DO, .. RIS Assignment Submission & Scoring Assignment Submission For this assignment, you submit answers by question parts. The number of submissions remaining for each question part only changes if you submit or change the answer. Assignment Scoring Your best submission for each question part is used for your score. ASK YOUR TEACHER Find the regression line for the a.a"t.upomts. X __y 1 1 2 6 3 9 4 14 Submit Answer Home My Assignments Request Extension Copyright 1998 - 2024 Cengage Learn Inc. All Rights Reserved ' TERMS OF USE PRIVACY @ webassign.net W) MATH 1130, section DO, .. IS Assignment Submission & Scoring Assignment Submission For this assignment, you submit answers by question parts. The number of submissions remaining for each question part only changes if you submit or change the answer. Assignment Scoring Your best submission for each question part is used for your score. SMITHNM13 14.4.054. The following data are measurements of temperature (x = I;)"::;.r;a\"chlrplng frequency (y = chirps per second) for the striped ground cricket. Temperature 31.4 22.0 34.1 29.1 27.0 24.0 209 27.8 Frequency 209 16.6 199 18.3 17.8 152 147 17.8 Temperature 20.8 28.5 26.4 28.1 27.0 28.6 24.6 Frequency 15.2 16.3 152 17.8 16.1 17.5 14.1 Find the best-fitting line for the data. (Round your values to three decimal places.) y'= Submit Answer Home My Assignments Request Extension Copyright 1998 - 2024 Cengage Learn Inc. All Rights Reserved ' TERMS OF USE PRIVACY The board of dir.. Search Results | Course.. 6 DETAILS MY NOTES SMITHNM13 14.4.030. ASK YOUR TEACHER Draw a scatter diagram and find r for the data shown in the table. (Round r to three decimal places.) X y 10 15 20 48 30 60 30 58 75 ;0 30 Graph Layers After you add an object to the graph you can use Graph Layers to view and edit its properties. Fill No Solution Help 5 10 15 20 25 30 35 45 50 55 60 WebAssign. Graphing Tool r = Submit
Step by Step Solution
There are 3 Steps involved in it

Get step-by-step solutions from verified subject matter experts