

Question: Webmasters.com has developed a powerful new server that would be used for corporations' Internet activities. It would cost $10 million at Year 0 to buy
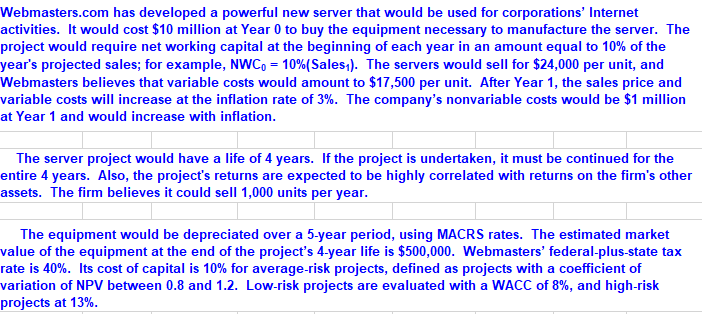
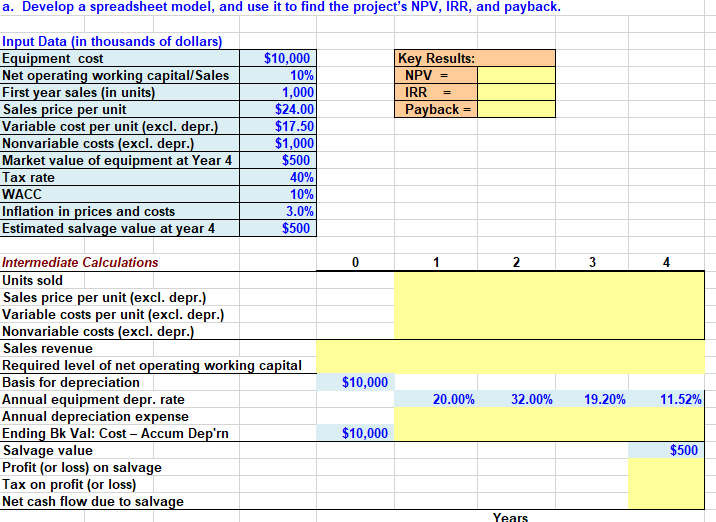
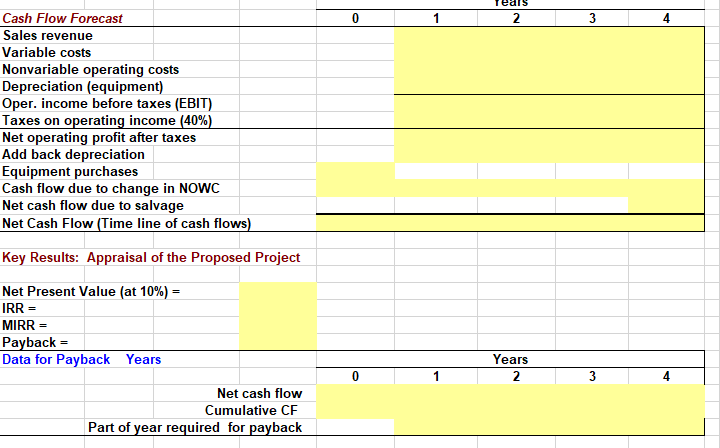
Webmasters.com has developed a powerful new server that would be used for corporations' Internet activities. It would cost $10 million at Year 0 to buy the equipment necessary to manufacture the server. The project would require net working capital at the beginning of each year in an amount equal to 10% of the year's projected sales; for example, NW Co = 10%(Sales). The servers would sell for $24,000 per unit, and Webmasters believes that variable costs would amount to $17,500 per unit. After Year 1, the sales price and variable costs will increase at the inflation rate of 3%. The company's nonvariable costs would be $1 million at Year 1 and would increase with inflation. The server project would have a life of 4 years. If the project is undertaken, it must be continued for the entire 4 years. Also, the project's returns are expected to be highly correlated with returns on the firm's other assets. The firm believes it could sell 1,000 units per year. The equipment would be depreciated over a 5-year period, using MACRS rates. The estimated market value of the equipment at the end of the project's 4-year life is $500,000. Webmasters' federal-plus-state tax rate is 40%. Its cost of capital is 10% for average-risk projects, defined as projects with a coefficient of variation of NPV between 0.8 and 1.2. Low-risk projects are evaluated with a WACC of 8%, and high-risk projects at 13%. a. Develop a spreadsheet model, and use it to find the project's NPV, IRR, and payback. Key Results: NPV = IRR Payback = Input Data (in thousands of dollars) Equipment cost Net operating working capital/Sales First year sales (in units) Sales price per unit Variable cost per unit (excl. depr.) Nonvariable costs (excl. depr.) Market value of equipment at Year 4 Tax rate WACC Inflation in prices and costs Estimated salvage value at year 4 $10,000 10% 1,000 $24.00 $17.50 $1,000 $500 40% 10% 3.0% $500 0 1 2 4 Intermediate Calculations Units sold Sales price per unit (excl. depr.) Variable costs per unit (excl. depr.) Nonvariable costs (excl. depr.) Sales revenue Required level of net operating working capital Basis for depreciation Annual equipment depr. rate Annual depreciation expense Ending Bk Val: Cost - Accum Dep'n Salvage value Profit (or loss) on salvage Tax on profit (or loss) Net cash flow due to salvage $10,000 20.00% 32.00% 19.20% 11.52% $10,000 $500 Years 0 1 2 3 Cash Flow Forecast Sales revenue Variable costs Nonvariable operating costs Depreciation (equipment) Oper. income before taxes (EBIT) Taxes on operating income (40%) Net operating profit after taxes Add back depreciation Equipment purchases Cash flow due to change in NOWC Net cash flow due to salvage Net Cash Flow (Time line of cash flows) Key Results: Appraisal of the Proposed Project Net Present Value (at 10%) = IRR MIRR = Payback = Data for Payback Years Years 2 0 1 3 4 Net cash flow Cumulative CF Part of year required for payback Webmasters.com has developed a powerful new server that would be used for corporations' Internet activities. It would cost $10 million at Year 0 to buy the equipment necessary to manufacture the server. The project would require net working capital at the beginning of each year in an amount equal to 10% of the year's projected sales; for example, NW Co = 10%(Sales). The servers would sell for $24,000 per unit, and Webmasters believes that variable costs would amount to $17,500 per unit. After Year 1, the sales price and variable costs will increase at the inflation rate of 3%. The company's nonvariable costs would be $1 million at Year 1 and would increase with inflation. The server project would have a life of 4 years. If the project is undertaken, it must be continued for the entire 4 years. Also, the project's returns are expected to be highly correlated with returns on the firm's other assets. The firm believes it could sell 1,000 units per year. The equipment would be depreciated over a 5-year period, using MACRS rates. The estimated market value of the equipment at the end of the project's 4-year life is $500,000. Webmasters' federal-plus-state tax rate is 40%. Its cost of capital is 10% for average-risk projects, defined as projects with a coefficient of variation of NPV between 0.8 and 1.2. Low-risk projects are evaluated with a WACC of 8%, and high-risk projects at 13%. a. Develop a spreadsheet model, and use it to find the project's NPV, IRR, and payback. Key Results: NPV = IRR Payback = Input Data (in thousands of dollars) Equipment cost Net operating working capital/Sales First year sales (in units) Sales price per unit Variable cost per unit (excl. depr.) Nonvariable costs (excl. depr.) Market value of equipment at Year 4 Tax rate WACC Inflation in prices and costs Estimated salvage value at year 4 $10,000 10% 1,000 $24.00 $17.50 $1,000 $500 40% 10% 3.0% $500 0 1 2 4 Intermediate Calculations Units sold Sales price per unit (excl. depr.) Variable costs per unit (excl. depr.) Nonvariable costs (excl. depr.) Sales revenue Required level of net operating working capital Basis for depreciation Annual equipment depr. rate Annual depreciation expense Ending Bk Val: Cost - Accum Dep'n Salvage value Profit (or loss) on salvage Tax on profit (or loss) Net cash flow due to salvage $10,000 20.00% 32.00% 19.20% 11.52% $10,000 $500 Years 0 1 2 3 Cash Flow Forecast Sales revenue Variable costs Nonvariable operating costs Depreciation (equipment) Oper. income before taxes (EBIT) Taxes on operating income (40%) Net operating profit after taxes Add back depreciation Equipment purchases Cash flow due to change in NOWC Net cash flow due to salvage Net Cash Flow (Time line of cash flows) Key Results: Appraisal of the Proposed Project Net Present Value (at 10%) = IRR MIRR = Payback = Data for Payback Years Years 2 0 1 3 4 Net cash flow Cumulative CF Part of year required for payback
Step by Step Solution
There are 3 Steps involved in it

Get step-by-step solutions from verified subject matter experts