

Question: WeBWork : MA336_JUN2021 X * Homework Help - Q&A from X @ calculator - Google Search .edu (1 point) (a) Create a frequency distribution table
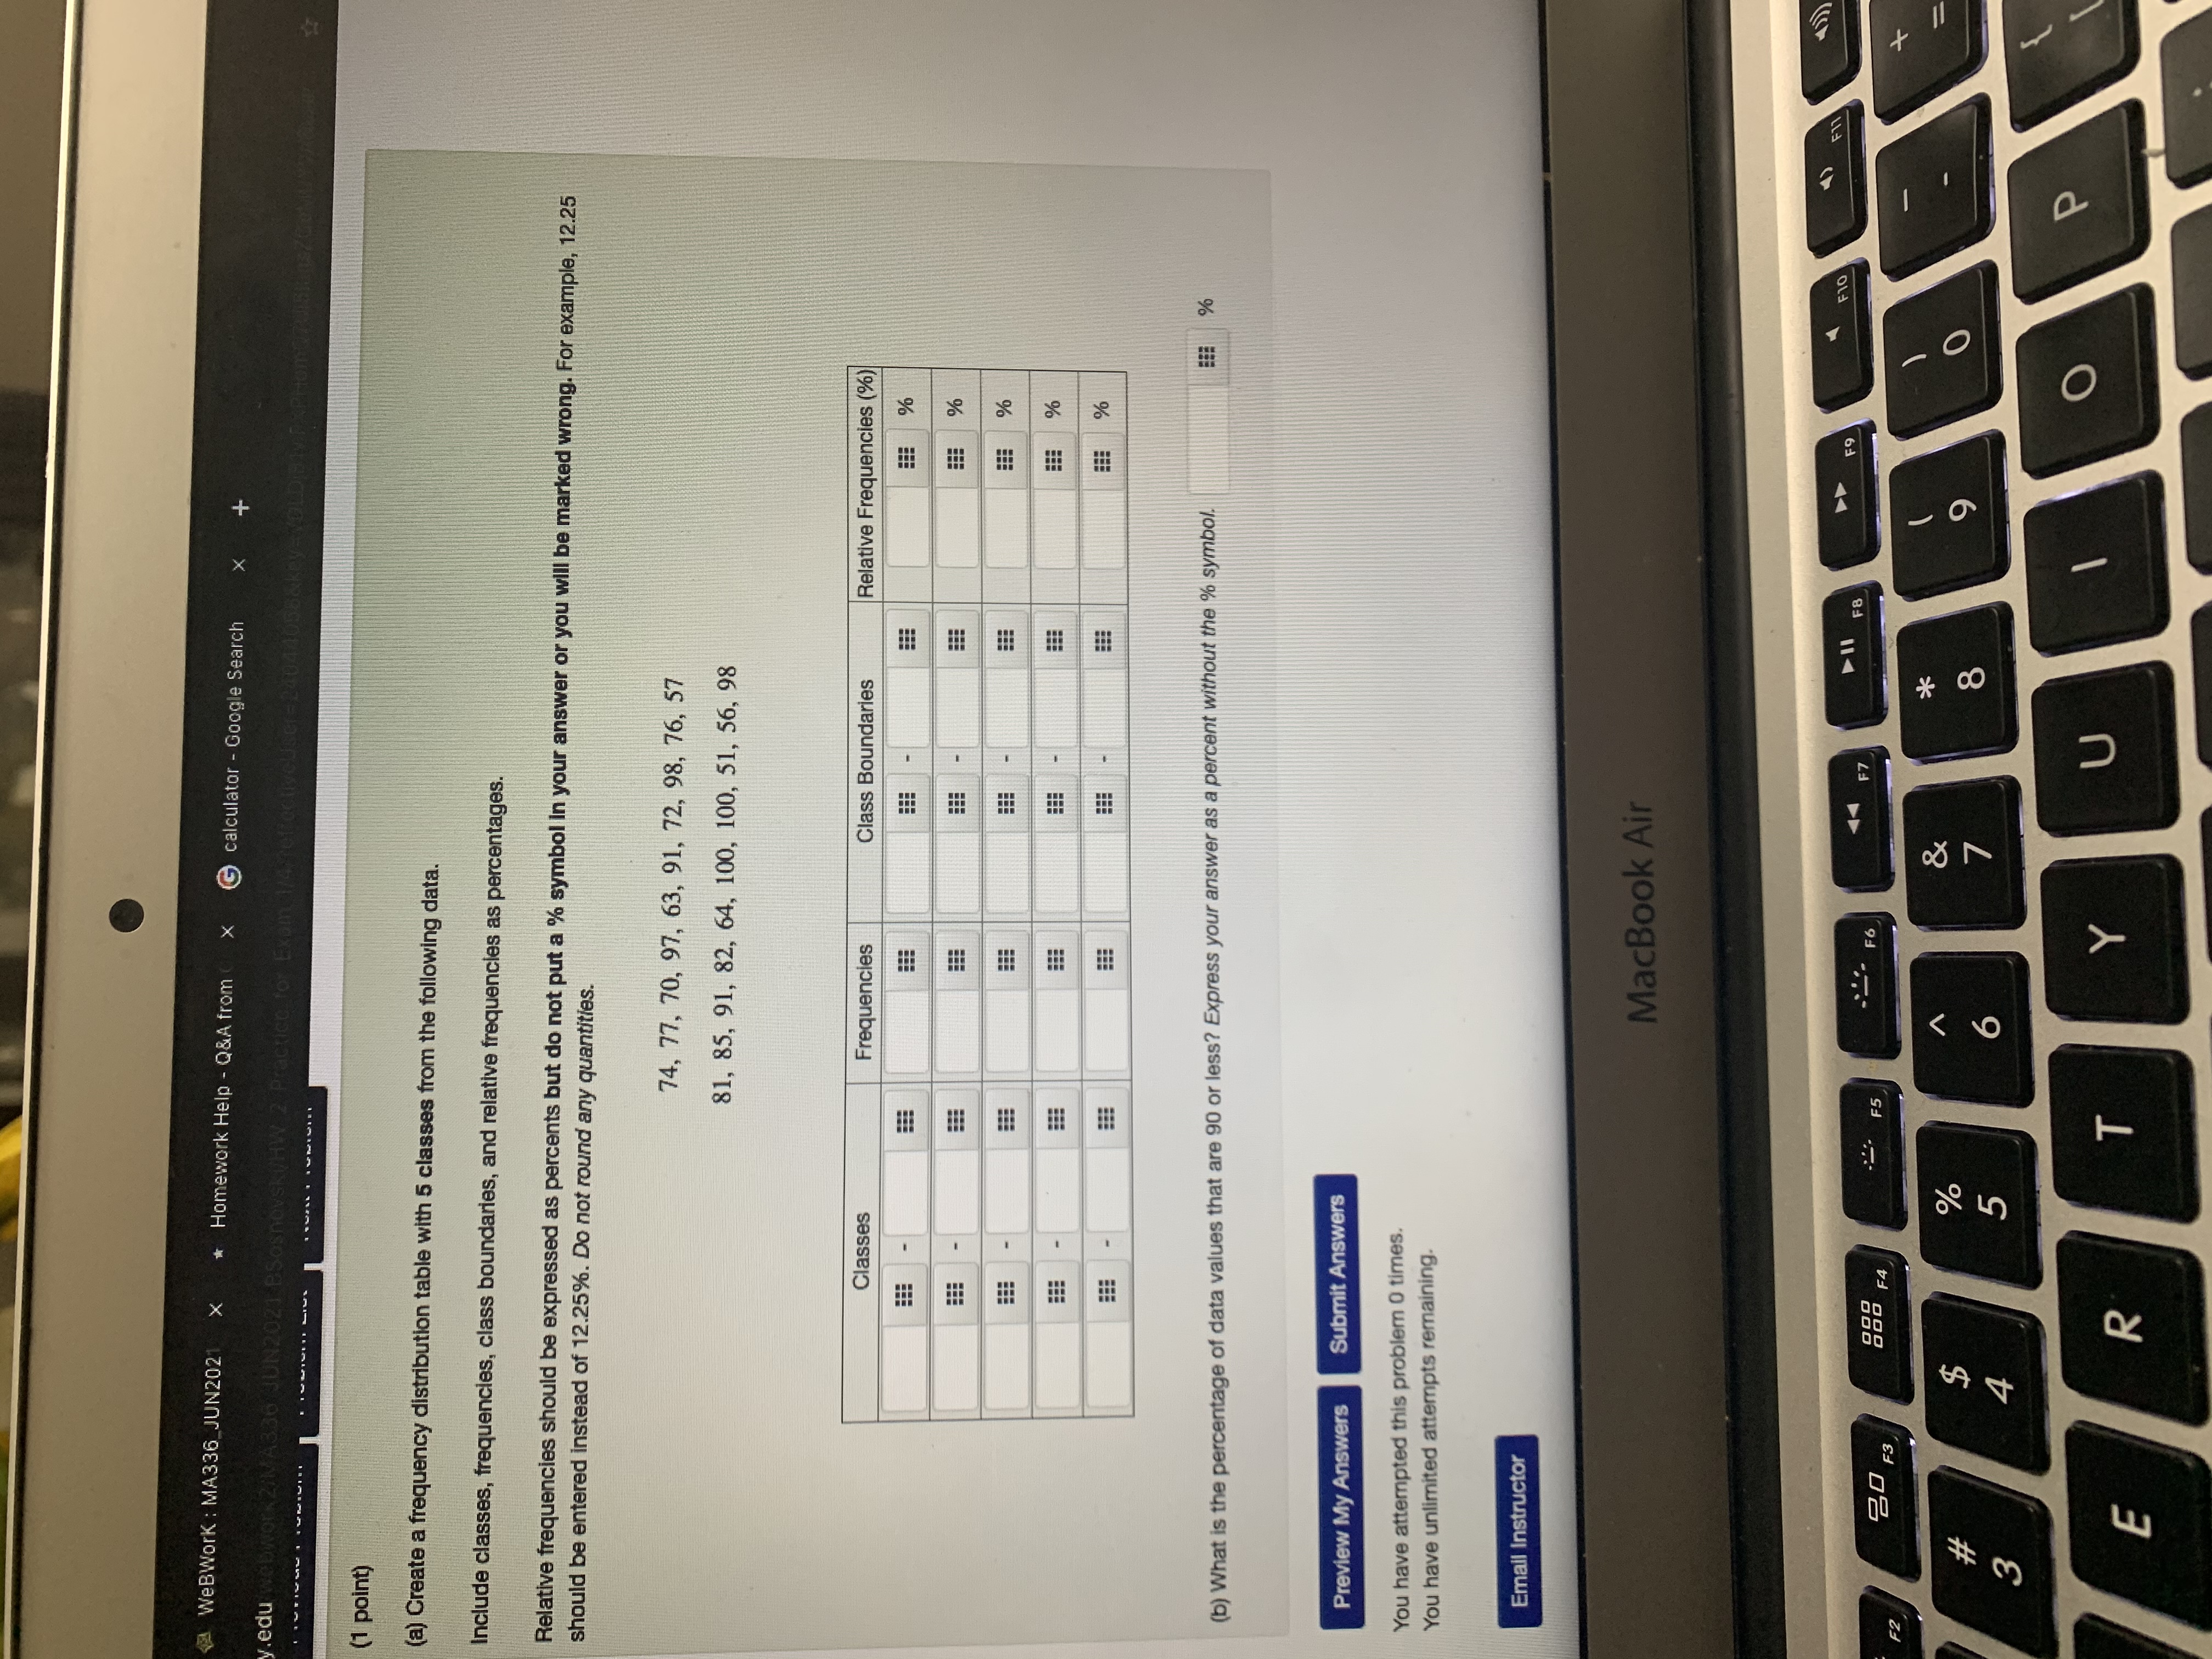
WeBWork : MA336_JUN2021 X * Homework Help - Q&A from X @ calculator - Google Search .edu (1 point) (a) Create a frequency distribution table with 5 classes from the following data. Include classes, frequencies, class boundaries, and relative frequencies as percentages. Relative frequencies should be expressed as percents but do not put a % symbol In your answer or you will be marked wrong. For example, 12.25 should be entered instead of 12.25%. Do not round any quantities. 74, 77, 70, 97, 63, 91, 72, 98, 76, 57 81, 85, 91, 82, 64, 100, 100, 51, 56, 98 Classes Frequencies Class Boundaries Relative Frequencies (%) % % % % BEE % (b) What is the percentage of data values that are 90 or less? Express your answer as a percent without the % symbol. Preview My Answers Submit Answers You have attempted this problem 0 times. You have unlimited attempts remaining. Email Instructor MacBook Air F17 45) FB F9 F10 2 F5 - F6 F7 20 F3 F4 F2 A & O 7 8 9 W # 5 6 T Y U E RWeBWork : MA336_JUN2021 Homework Help - Q&A from ( x G calculator - Google Search cuny.edu webwork2/MA336 JUN2021 BSosnovski/HW 2 Practice for Exam 1/2/?effectiveUser=24044058&key-VDLDjBIVIPXPHo MAA MATHEMATICAL ASSOCIATION OF AMERICA
Step by Step Solution
There are 3 Steps involved in it

Get step-by-step solutions from verified subject matter experts