Question: WEEK 06 ASSIGNMENT A6 EXERCISE EXERCISE 1: THE BLOCK WALL You have a project to build a new block wall around the house. The block
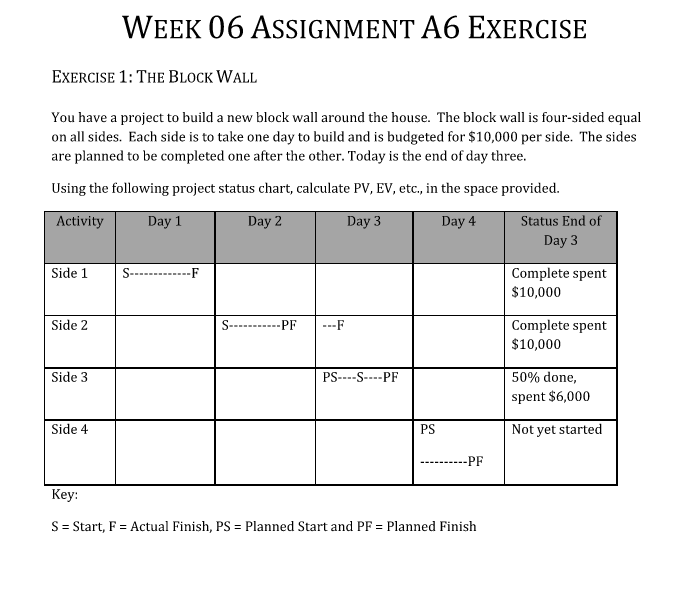
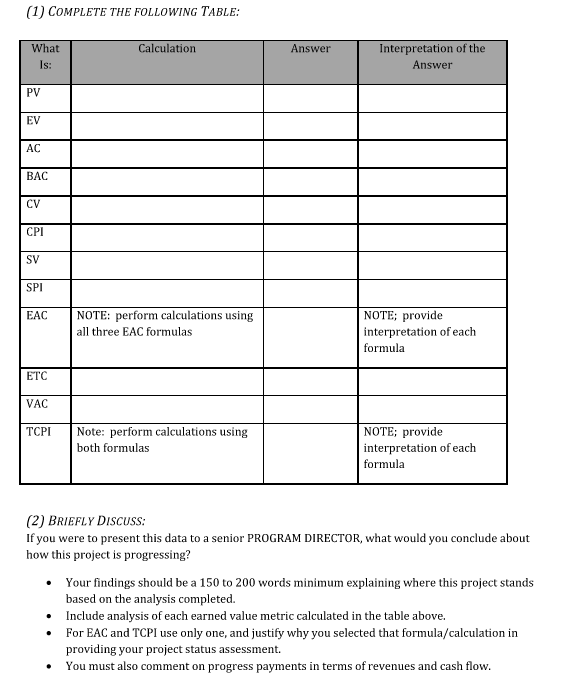
WEEK 06 ASSIGNMENT A6 EXERCISE EXERCISE 1: THE BLOCK WALL You have a project to build a new block wall around the house. The block wall is four-sided equal on all sides. Each side is to take one day to build and is budgeted for $10,000 per side. The sides are planned to be completed one after the other. Today is the end of day three. Using the following project status chart, calculate PV, EV, etc., in the space provided. Activity Day 1 Day 2 Day 3 Day 4 Status End of Day 3 Side 1 S- F Complete spent $10,000 Side 2 S-PF Complete spent $10,000 Side 3 PS----S-PF 50% done, spent $6,000 Side 4 PS Not yet started -PF Key: S = Start, F = Actual Finish, PS = Planned Start and PF = Planned Finish (1) COMPLETE THE FOLLOWING TABLE: What Calculation Answer Interpretation of the Answer Is: PV EV AC BAC CV SV SPI EAC NOTE: perform calculations using all three EAC formulas NOTE: provide interpretation of each formula ETC VAC TCPI Note: perform calculations using both formulas NOTE: provide interpretation of each formula (2) BRIEFLY Discuss: If you were to present this data to a senior PROGRAM DIRECTOR, what would you conclude about how this project is progressing? Your findings should be a 150 to 200 words minimum explaining where this project stands based on the analysis completed. Include analysis of each earned value metric calculated in the table above. For EAC and TCPI use only one, and justify why you selected that formula/calculation in providing your project status assessment. You must also comment on progress payments in terms of revenues and cash flow. WEEK 06 ASSIGNMENT A6 EXERCISE EXERCISE 1: THE BLOCK WALL You have a project to build a new block wall around the house. The block wall is four-sided equal on all sides. Each side is to take one day to build and is budgeted for $10,000 per side. The sides are planned to be completed one after the other. Today is the end of day three. Using the following project status chart, calculate PV, EV, etc., in the space provided. Activity Day 1 Day 2 Day 3 Day 4 Status End of Day 3 Side 1 S- F Complete spent $10,000 Side 2 S-PF Complete spent $10,000 Side 3 PS----S-PF 50% done, spent $6,000 Side 4 PS Not yet started -PF Key: S = Start, F = Actual Finish, PS = Planned Start and PF = Planned Finish (1) COMPLETE THE FOLLOWING TABLE: What Calculation Answer Interpretation of the Answer Is: PV EV AC BAC CV SV SPI EAC NOTE: perform calculations using all three EAC formulas NOTE: provide interpretation of each formula ETC VAC TCPI Note: perform calculations using both formulas NOTE: provide interpretation of each formula (2) BRIEFLY Discuss: If you were to present this data to a senior PROGRAM DIRECTOR, what would you conclude about how this project is progressing? Your findings should be a 150 to 200 words minimum explaining where this project stands based on the analysis completed. Include analysis of each earned value metric calculated in the table above. For EAC and TCPI use only one, and justify why you selected that formula/calculation in providing your project status assessment. You must also comment on progress payments in terms of revenues and cash flow


