

Question: Week 1 2 3 4 5 6 7 8 9 10 Registrations 22 21 24 26 35 30 32 34 36 34 a) Starting with
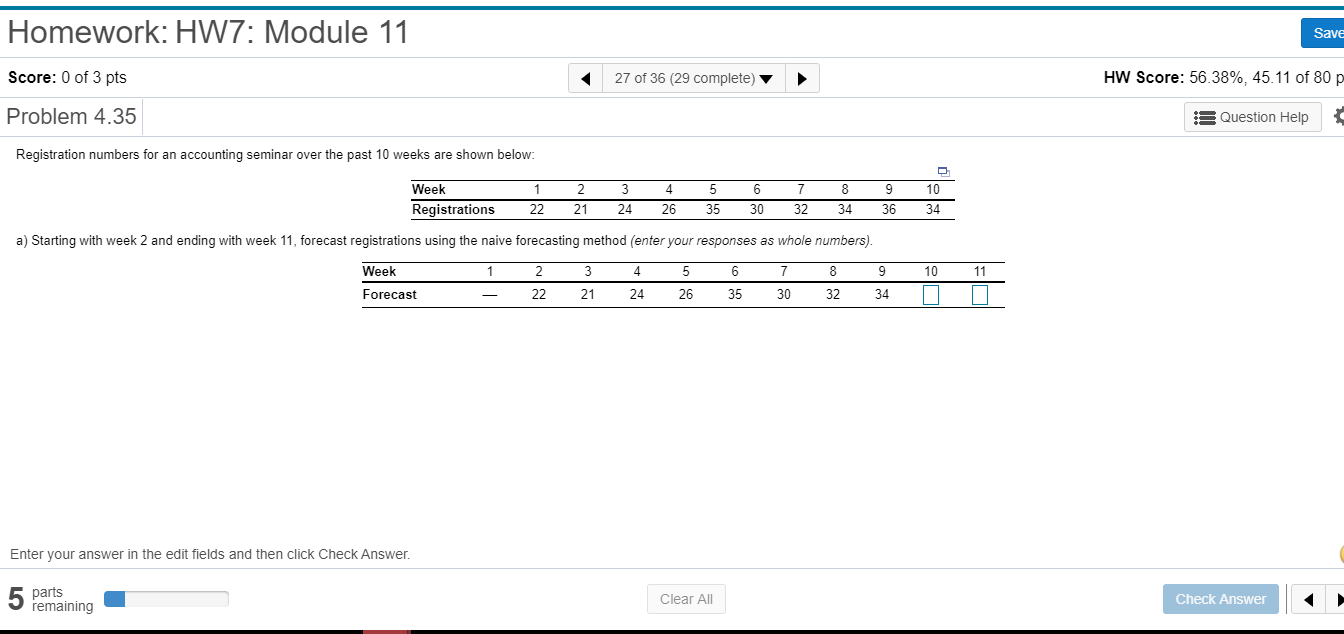
Week 1 2 3 4 5 6 7 8 9 10 Registrations 22 21 24 26 35 30 32 34 36 34 a) Starting with week 2 and ending with week 11, forecast registrations using the naive forecasting method. b) Starting with week 3 and ending with week 11, forecast registration using a two-week moving average. c) Starting with week 5 and ending with week 11, forecast registrations using a four-week moving average. d) Plot the original data and the three forecasts on the same graph. Which forecast smoothes the data the most? Which forecast responds to change the best?
Step by Step Solution
There are 3 Steps involved in it
1 Expert Approved Answer
Step: 1 Unlock

Question Has Been Solved by an Expert!
Get step-by-step solutions from verified subject matter experts
Step: 2 Unlock
Step: 3 Unlock