

Question: Week 1 Assignment 2 ( Project) Project Week 1 Scenario: You have been approached by someone who is trying to figure out whether to pursue
Week 1 Assignment 2 (Project)
Project Week 1
Scenario: You have been approached by someone who is trying to figure out whether to pursue a business degree or an engineering degree. The person can afford either one, and the person likes both topics equally well. Your job is to focus on ROI. The central question for you to answer in this course is which major, business or engineering, will give this person the better ROI?
In this data set the ROI data set - for 2 different majors (Business and Engineering), you are given a sample of the 20 best colleges according to ROI (ROI = Return on Investment) and their School Type, Cost, 30-Year ROI, and Annual % ROI.
The Week 8 project is completed in part every week. Each week, one section is due. If you do each week's projectand adjust it if necessary with the feedback, your Week 8 project will go a lot better than if you do not. Open the spreadsheet.
Class | Frequency |
0.060-0.064 | 1 |
0.065-0.069 | 3 |
0.070-0.074 | 3 |
0.075-0.079 | 2 |
Interpretation questions: It many sound strange, but put these answers in TWO paragraphs. The reason is that the Week 8 project is a paper that summarizes all the weekly projects. If you already have paragraphs, it will save you time later as you will most likely be able to copy/paste them together. Answer 1 and 2 in a single paragraph. Answer 3-6 in another.
** Assume that the sample of schools represents the population.
1. What is ROI? Tell us more than just the acronym.
2. Define what each of the four columns on the spreadsheet is. Go beyond naming the column. For example, one column is Cost. Cost of what?
3. If the person chooses to major in business, is he/she more likely to go to a public or private school?
4. If the person chooses to major in engineering, is he/she more likely to go to a public or private school?
5. What are some pros and cons to attending public vs. private schools?
6. Which bar on each histogram was the highest? What does that mean for a likely % ROI for each major?
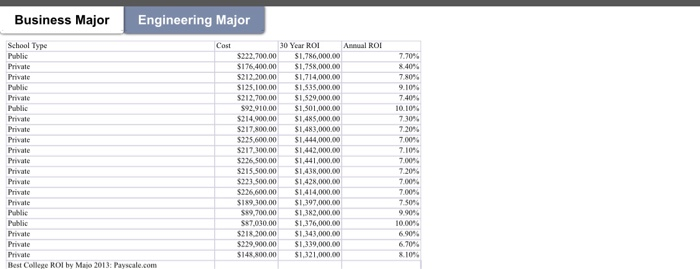
Business Major Engineering Major Cost School Type Public Private Private Public Private Public Private Private Private Private Private Private Private Private Private Public Public Private Private Private Best College ROI by Maio 2013: Payscale.com 30 Year B Amnual ROI S222,700,00 $1,786,000.00 $176,400.00 $1,758,000.00 S212.200,00 $1,714,000.00 $125,100.00 $1,335,000.00 S212.700.00 $1.529,000.00 $92.910.00 $1,501,000.00 $214,900.00 $1,485,000.00 $217,800.00 $1,483,000.00 $225,600.00 $1.444,000.00 $217,300.00 $1,442,000.00 $226,500.00 $1,441,000.00 $215,500.00 $1,438,000.00 $223,500.00 $1,428,000.00 $226,600.00 $1,414,000.00 $189.300,00 $1,397,000.00 559,700.00 $1,382,000.00 $87,030.00 $1,376,000.00 $218.200.00 $1,343,000.00 $229,900.00 $1,339,000.00 $145.800.00 $1,321,000.00 7.70% 8.40% 7.80% 9.10% 7.40 10.10% 730% 7.20% 7.00% 7.10% 7.00% 7.20% 7.00% 7.00% 7.50% 9.90 10.00 6.90% 6.70% 8.109 Business Major Engineering Major Cost School Type Public Private Private Public Private Public Private Private Private Private Private Private Private Private Private Public Public Private Private Private Best College ROI by Maio 2013: Payscale.com 30 Year B Amnual ROI S222,700,00 $1,786,000.00 $176,400.00 $1,758,000.00 S212.200,00 $1,714,000.00 $125,100.00 $1,335,000.00 S212.700.00 $1.529,000.00 $92.910.00 $1,501,000.00 $214,900.00 $1,485,000.00 $217,800.00 $1,483,000.00 $225,600.00 $1.444,000.00 $217,300.00 $1,442,000.00 $226,500.00 $1,441,000.00 $215,500.00 $1,438,000.00 $223,500.00 $1,428,000.00 $226,600.00 $1,414,000.00 $189.300,00 $1,397,000.00 559,700.00 $1,382,000.00 $87,030.00 $1,376,000.00 $218.200.00 $1,343,000.00 $229,900.00 $1,339,000.00 $145.800.00 $1,321,000.00 7.70% 8.40% 7.80% 9.10% 7.40 10.10% 730% 7.20% 7.00% 7.10% 7.00% 7.20% 7.00% 7.00% 7.50% 9.90 10.00 6.90% 6.70% 8.109
Step by Step Solution
There are 3 Steps involved in it

Get step-by-step solutions from verified subject matter experts