

Question: Week 1 MyOpenMath Assignment - Introduction to Statistics & Sampling Methods Score: 8.5/18 Answered: 1 8 @ Question 12 v The following data represents the
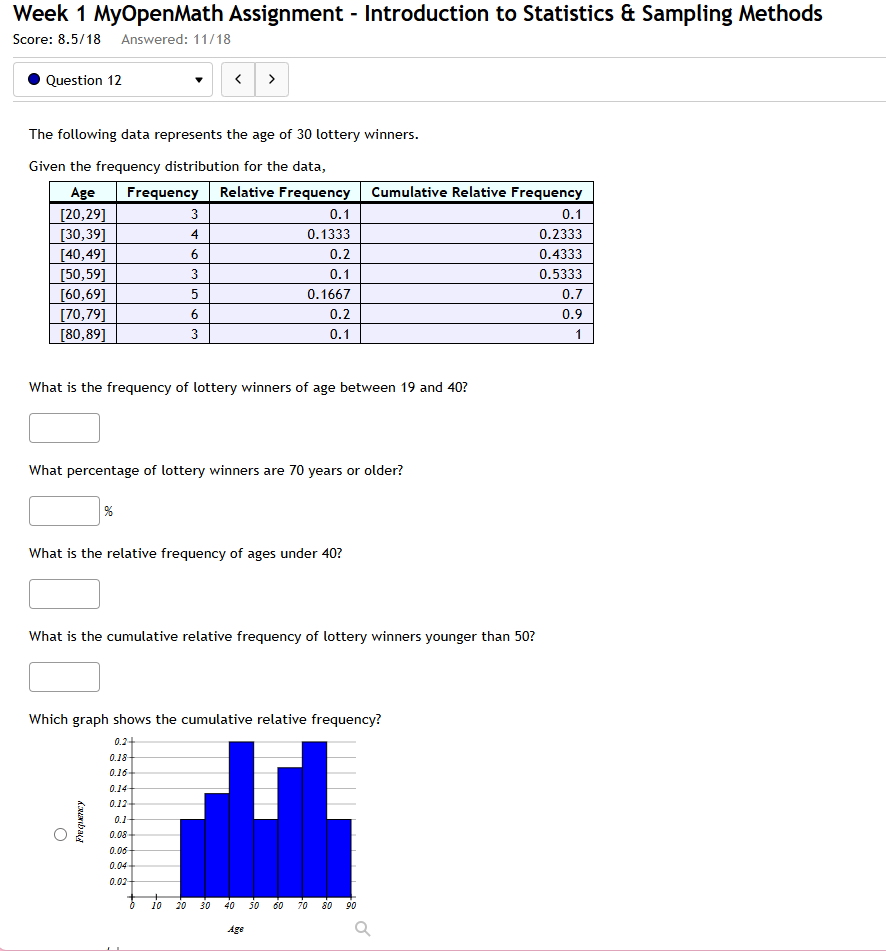
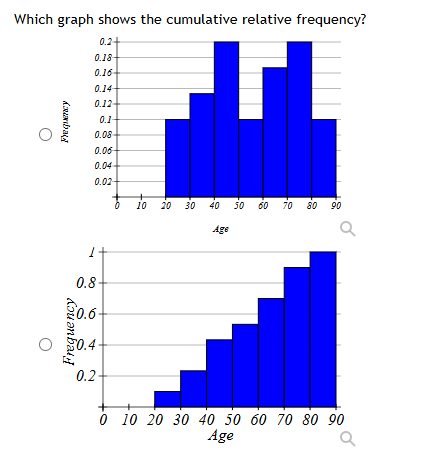
Week 1 MyOpenMath Assignment - Introduction to Statistics & Sampling Methods Score: 8.5/18 Answered: 1 8 @ Question 12 v The following data represents the age of 30 lottery winners. Given the frequency distribution for the data, Age Frequency | Relative Frequency | Cumulative Relative Frequency 0.1 [30,39] 4 0.1333 0.2333 [40,49] 6 0.2 0.4333 [50,59] 3 0.1 0.5333 0.7 [70,79] 6 0.2 0.9 [80,89] 3 0.1 1 What is the frequency of lottery winners of age between 19 and 407 What percentage of lottery winners are 70 years or older? What is the relative frequency of ages under 407 What is the cumulative relative frequency of lottery winners younger than 507 Which graph shows the cumulative relative frequency? 0.24 018 .16+ 014+ 012+ i+ .08+ .08 .04+ 0.02+ - I Fiegqueny Which graph shows the cumulative relative frequency? 0.7 0.18 0.16- 0.14 0.17- 0.1 Frequency O 0.08 0.06 0.04 0.07 10 30 30 40 50 60 70 50 90 Age a 0.8 0.6 Mou anbad O 0.4 0.2 0 10 20 30 40 50 60 70 80 90 Age
Step by Step Solution
There are 3 Steps involved in it

Get step-by-step solutions from verified subject matter experts