

Question: Week 1 Spreadsheet Assignment In this assignment create spreadsheet models to price coupon bonds, compute duration, and examine reinvestment risk. The purpose of this assignment
Week 1 Spreadsheet Assignment
In this assignment create spreadsheet models to price coupon bonds, compute duration, and examine reinvestment risk. The purpose of this assignment is to get comfortable with basic spreadsheet modeling and to reinforce the concepts of bond pricing, present value, and duration. Please display formulas using the FORMULATEXT command. Some of these have been pre- populated in the homework template.
This assignment has threeparts. You should upload a single Excel spreadsheet. Please do not insert or delete rows/columns and be sure answers are in the indicated shaded regions. Please be sure to include your name and student ID on the first sheet.
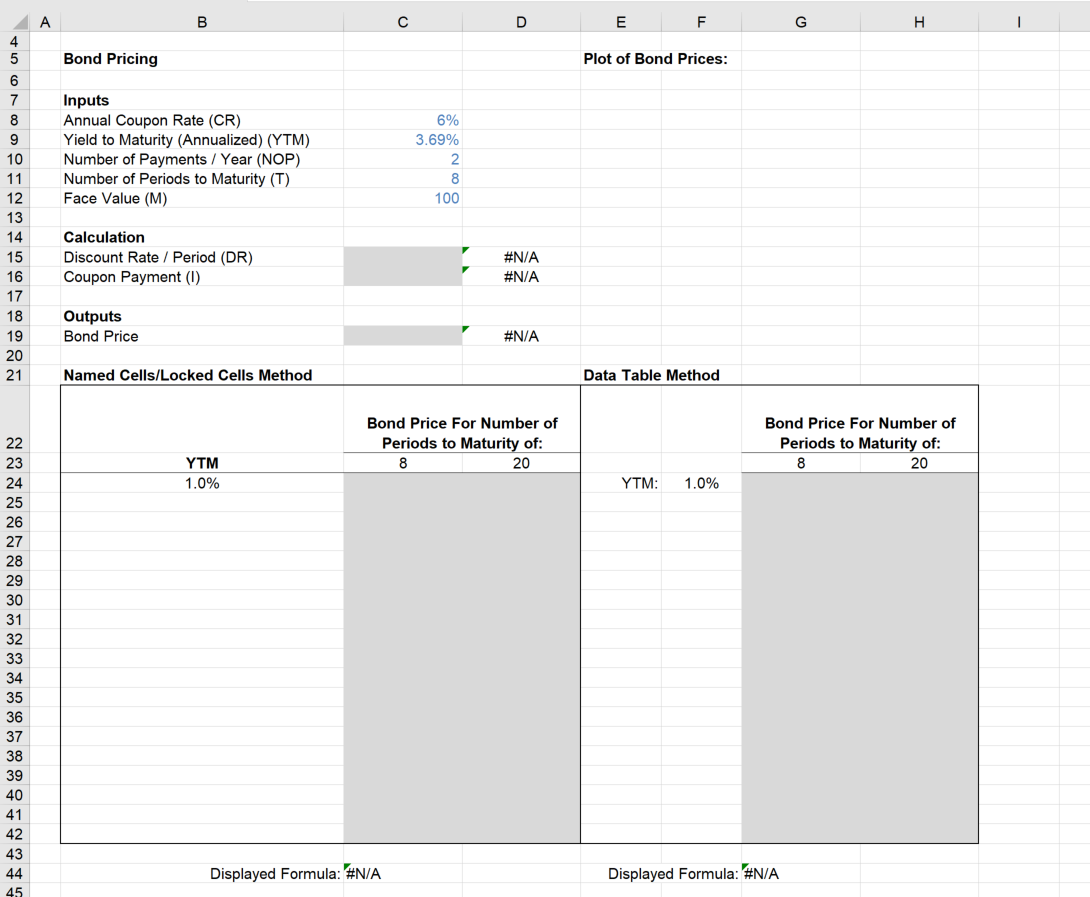
Part 1: Bond pricing sensitivity
The firstworksheet of the homework template ('Part 1') provides a basic bond pricing spreadsheet. This issimilar to the bond pricing sheet we used inclass. The assignment isto perform a sensitivity analysis of bond prices to changes inthe YTM. Please include the followingoutputs:
- The bond price for the displayed inputs - incellC19.
- A table of bond prices for YTMs ranging from 1% to 10% inincrements of 0.5% calculated using locked formulas and named cells (using the names indicated in parentheses). Please consider two maturities: 8 periods and 20periods.
- A corresponding table ofbond prices for the same YTMs, but calculated using an Excel Data Table. For this table, please also consider possible maturities of 8 periods and 20 periods.
- A chart of bond prices (on the y-axis) versus YTMs (on the x-axis). Again,the YTMs should run from 1% to 10% inincrements of 0.5%. Pleaseplot bond prices for both maturities from (2) & (3) above. That is,there should beone line for the 4-year bond and one linefor the 10 yearbond. Please format the plot sothat the y-axis runs from $50to
$175 in increments of $25. Label the lines and make the 10-year bond line dashed. (You can accomplish this using the chart tools formatting menu.)
Aside from the different maturities and YTMs, all other inputs should be kept the same as the template provides.
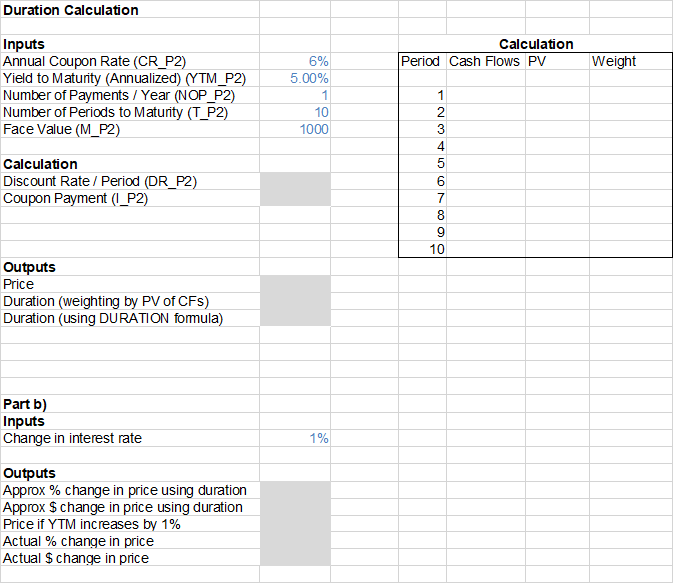
Part 2: Duration and price sensitivity
- Calculate the duration of a bond with a face of $1,000, a 6% coupon rate, and a 5% YTM with 1 payment per year and a maturity of 10 years,using two differentmethods:
- Weighting by the present value of cashflows
- The Excel DURATIONformula
- Calculate thefollowing:
- What are the approximatepercentage and dollarchanges inprice for a 1% change in interest rates using the duration approximationformula?
- What are the actualpercentage and dollar changes inprice if interest rates increase by 1%?
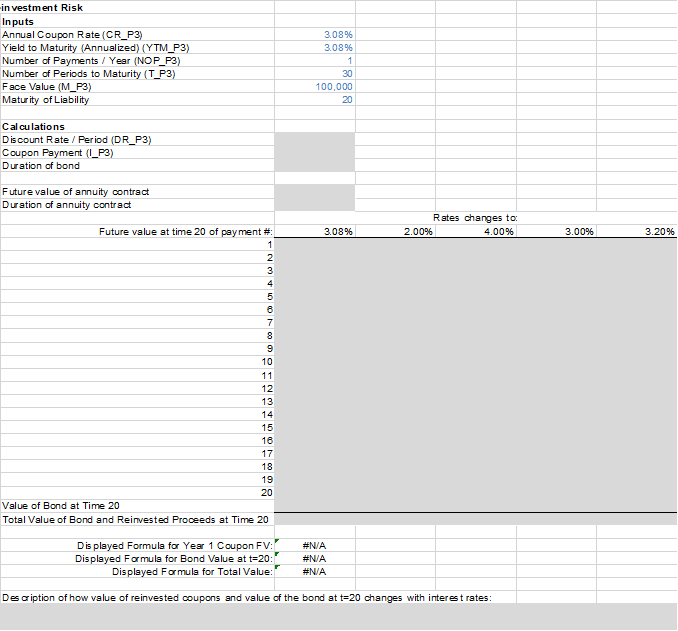
Part 3: Duration, reinvestment risk, & price risk
Consider a guaranteed annuity contract issuedby a lifeinsurance company with a rate of 3.08% and a termof20 years. For a $100,000 nominal amount, the insurance company ispromising topay $183,437.53 (=100,000*(1.0308)^20) to the holderof the guaranteed annuity contract in20 years. (In practice, this lump sum would bespread out over a subsequent period as an annuity; for simplicity, we will assume a lumpsum payment.) Wewant to know the interest rate risk exposure to the company ifitfunds this liability using a 30-year bond with a coupon rate of 3.08% issuedat par. To doso, assumethat inthe first year,rates change to one of the five possible values inrow 18 and then stay constant for the next 20 years. For each rate change, calculate two things: (1) the future value(as of 20 years down the road) of each coupon payment made by the 30-year bond for the next20 years, and (2) the value at year20 of the bond used to fund the obligation. For (1), assumethe coupons are reinvested at the new prevailing interest rate. The sum ofthe reinvested coupons and the value ofthe bond are the total future value ofthe assets used to finance the annuitycontract.
What isthe duration of the 30-year bond as oftoday? What isthe duration of the guaranteed annuity contract? Briefly describe how the value of the reinvested coupons and the value of the bond change as a function of interest rate changes. Will the insurance company beable to meetits obligation tothe purchaser of the guaranteed annuitycontract?
Part 1:
Step by Step Solution
There are 3 Steps involved in it

Get step-by-step solutions from verified subject matter experts