

Question: Week 3 - Case Study: Building a Live Stock Portfolio Tracker Attached Files: Grading Rubric Dynamic Live Stock Portfolio Tracker.docx ( 2 7 . 0
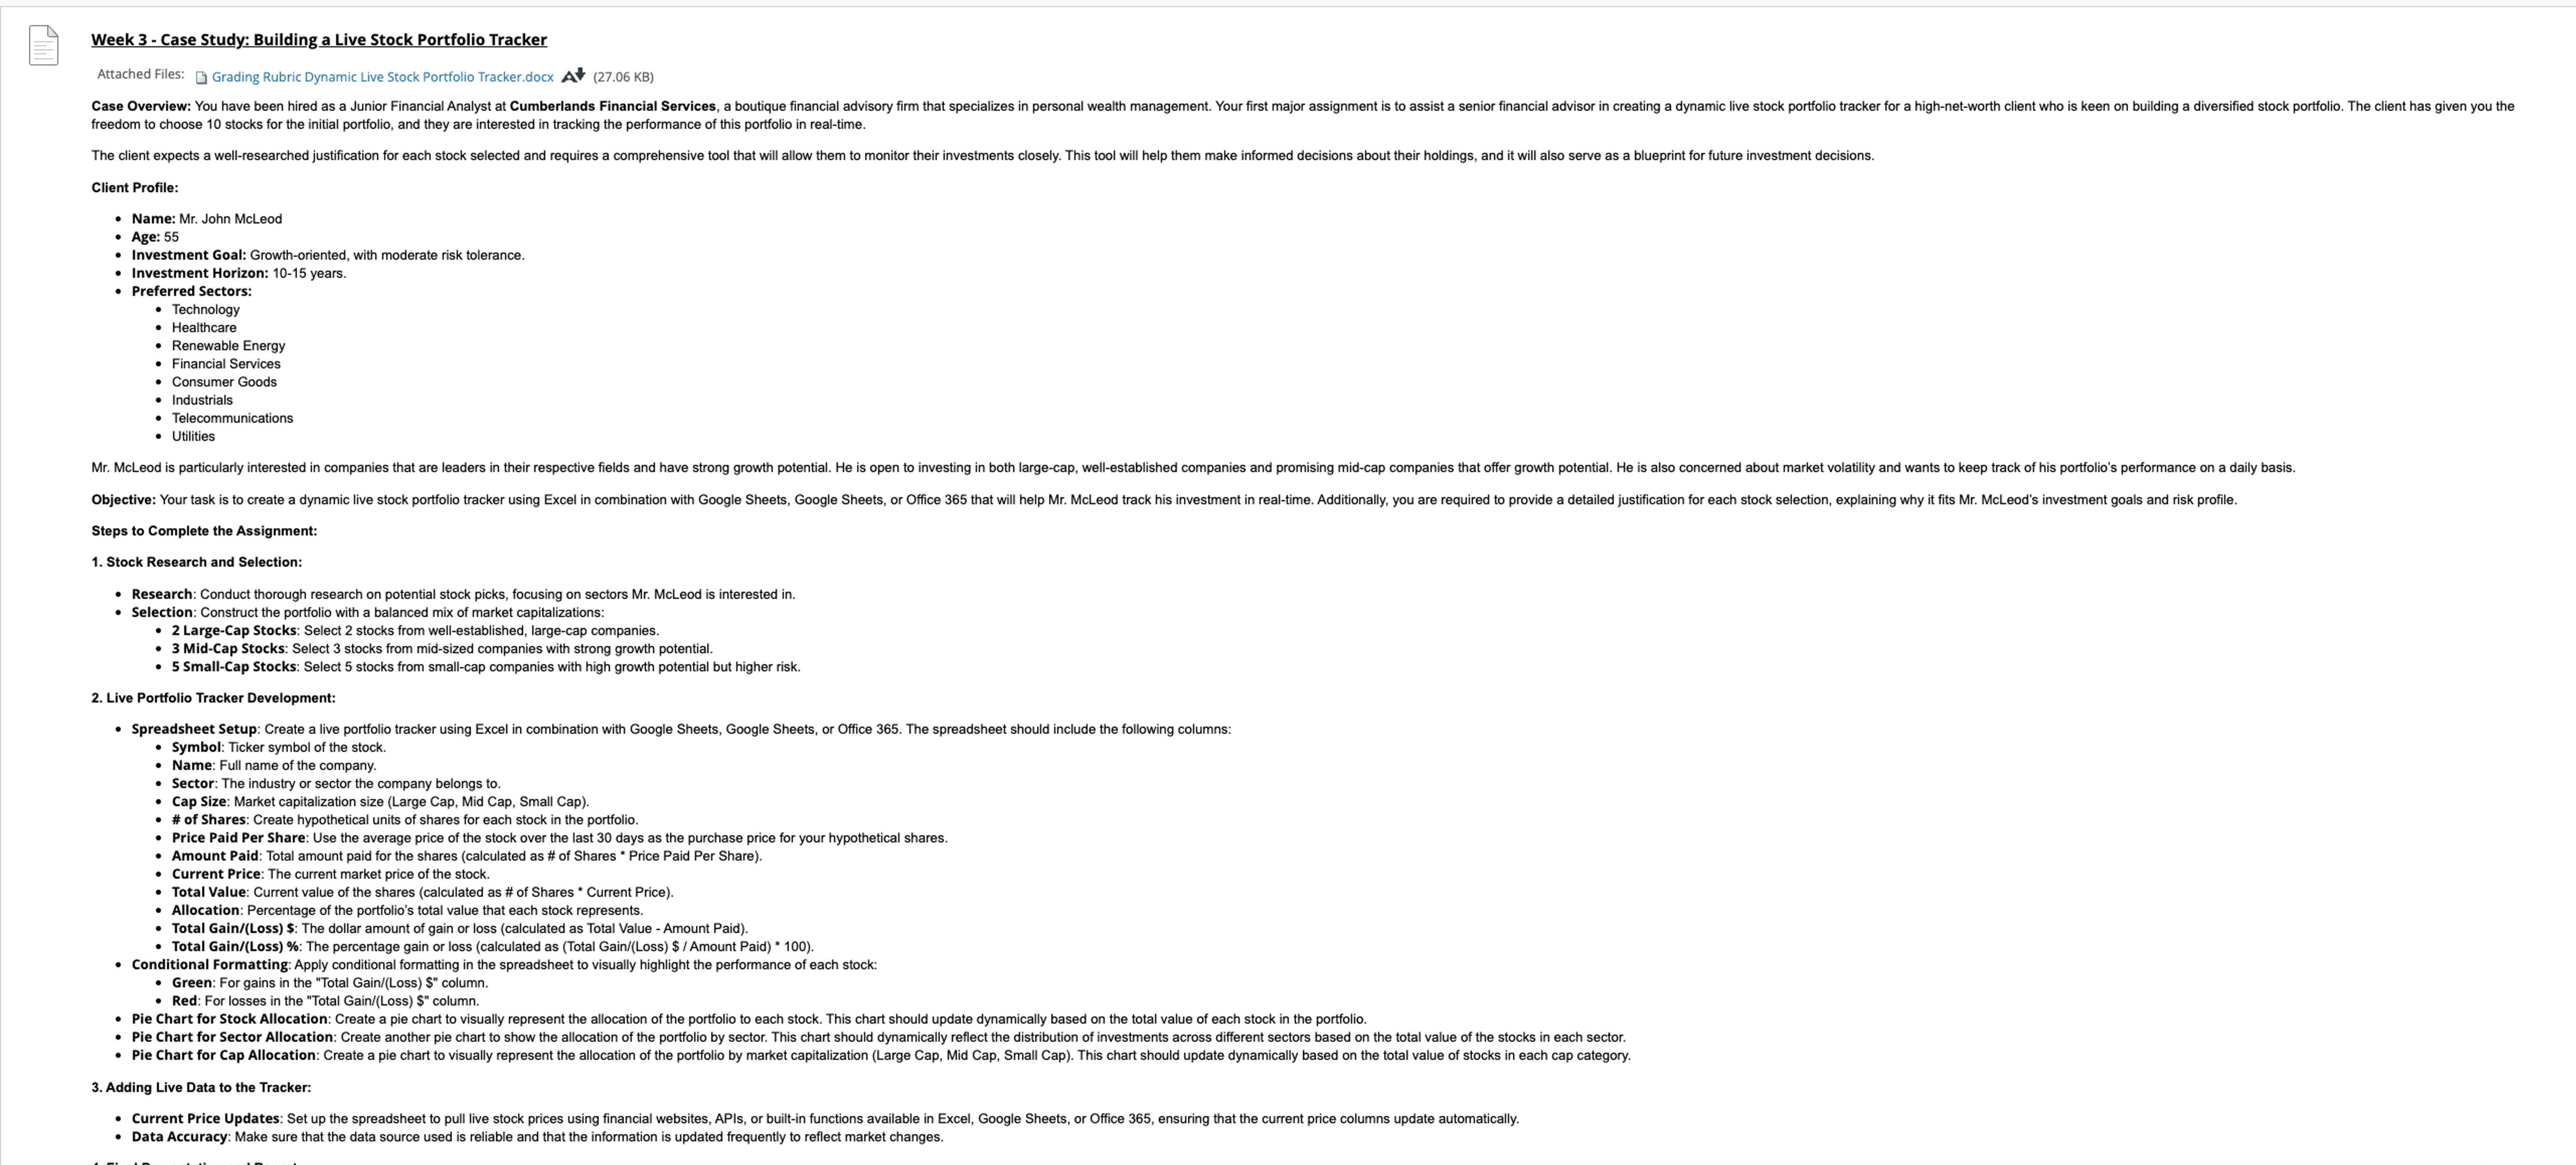
Week Case Study: Building a Live Stock Portfolio Tracker
Attached Files: Grading Rubric Dynamic Live Stock Portfolio Tracker.docx KB
freedom to choose stocks for the initial portfolio, and they are interested in tracking the performance of this portfolio in realtime.
Client Profile:
Name: Mr John McLeod
Age:
Investment Goal: Growthoriented, with moderate risk tolerance.
Investment Horizon: years.
Preferred Sectors.
Technology
Renewable Energy
Financial Services
Consumer Goods
Industrial
Utilities
Steps to Complete the Assignment:
Stock Research and Selection:
Research: Conduct thorough research on potential stock picks, focusing on sectors Mr McLeod is interested in
Selection: Construct the portfolio with a balanced mix of market capitalizations:
LargeCap Stocks: Select stocks from wellestablished, largecap companies
SmallCap Stocks: Sect stocks from midsized companies with strong growth potential.
Spreadsheet Setup: Create a live portfolio tracker using Excel in combination with Google Sheets, Google Sheets, or Office The spreadsheet should include the following columns:
Symbol: Ticker symbol of the stock.
Name: Full name of the company.
company belongs to
# of Share: Market capitalization size Large Cap, Mid Cap, Small Cap
# of Shares: Create hypothetical units of shares for each stock in the portfolio.
Price Paid Per Share: Use the average price of the stock ove
Current Price: The current market price of the stock
Total Value: Current value of the shares calculated as # of Shares Current Price
Allocation: Percentage of the portfolio's total value that each stock represents.
Total GainLoss $: The dollar amount of gain or loss calculated as Total Value Amount Paid
Conditional Formatting: Apply conditione gain or loss calculated as Total GainLoss $ Amount Paid
Green: For gains in the "Total GainLormatting in the spreadsheet to visually highlight the performance of each stock:
Red: For losses in the "Total GainLoss $ column.
Pie Chart for Stock Allocation: Create a pie chart to visually represent the allocation of the portfolio to each stock. This chart should update dynamically based on the total value of each stock in the portfolio
Adding Live Data to the Tracker:
Data Accuracy: Make sure that the data source used is reliable and that the information is updated frequently to reflect market changes.
Step by Step Solution
There are 3 Steps involved in it
1 Expert Approved Answer
Step: 1 Unlock

Question Has Been Solved by an Expert!
Get step-by-step solutions from verified subject matter experts
Step: 2 Unlock
Step: 3 Unlock