

Question: Week 3 R Studio Activity: Using Standard Scores For this activity you will need to access Table 4.2 in the Blackboard >6183>Content>Resources>Data tab. Table 4.2
 Week 3 R Studio Activity: Using Standard Scores
For this activity you will need to access Table 4.2 in the Blackboard >6183>Content>Resources>Data tab.
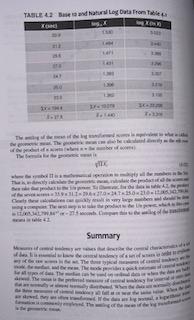
Table 4.2 shows test scores from four physical fitness knowledge examinations administered to twelve students in a physical fitness class.
What level of measurement do these data represent (i.e., nominal, ordinal, interval, ratio)?
What is the mean score for each examination?
What is the median score for each examination?
What is the mode for examination 2?
What is the range for each examination?
What is the standard deviation for each examination?
Use Table 4.2 data from the data file to complete Ch 4 Computer Activities. Next, and on the same document, center a title and label it, 'Comprehension Questions", and answer the following questions.
On a sheet of paper, write the two composite score columns next to each other. In the first column, list the original composite scores (COMPSCR). In the second column, list the composite T-scores. Rank the scores in each column from 1 to 12, assigning 1 to the highest score and 12 to the lowest score. Assume you are going to assign grades to the students as follows: A to rank 1; B to rank 2; B to rank 3; C+ to rank 4; C to ranks 5, 6, 7, and 8; C to rank 9; D+ to rank 10; D to rank 11; and F to rank 12. Answer the following questions:
What level of measurement do these data represent (i.e., nominal, ordinal, interval, ratio)?
What is the mean score for each examination?
What is the median score for each examination?
What is the mode for examination 2?
What is the range for each examination?
What is the standard deviation for each examination?
7.Are the rankings the same for the two composite distributions?
8.How many grades are different between the two distributions?
9.Determine what is unusual about student 1s performances on the tests.
10.What is strange about student 2s performances? How do the performances of these two students differ, and how are they the same?
11.What grades would be assigned to these two students if the total of the raw scores were used to determine grades?
12.What grades would be assigned to these two students if the total of the T-scores were used to determine grades?
13.Why are your answers to questions 11 and 12 different?
14.Based on your answers to questions 9 and 10, where should these two students total performances place them (approximately) in the class?
15.What are the means and standard deviations of the four T-score distributions, to one decimal place?
Use the following directions to answer items 1 through 15.
Open RStudio.
Install any necessary RStudio packages.
For Week 3, we do not require any additional packages.
Set up your RStudio workspace.
In the RStudio menu bar, click on File New File R Script.
On the first line of the R Script (upper left pane of RStudio), type
fill 5.armary
Step by Step Solution
There are 3 Steps involved in it

Get step-by-step solutions from verified subject matter experts