

Question: Week 4 Problem Set 1) Chapter 7 Problem 3.5 (Related to Solved Problem 7.3 around page 224) The following table shows the hourly output per
Week 4 Problem Set
1) Chapter 7 Problem 3.5 (Related to Solved Problem 7.3 around page 224)
The following table shows the hourly output per worker in two industries in Chile and Argentina.
Output per Hour of Work | ||
Hats | Beer (barrels) | |
Chile | 8 | 6 |
Argentina | 1 | 2 |
a. Explain which country has an absolute advantage in the production of hats and which country has an absolute advantage in the production of beer.
b. Explain which country has a comparative advantage in the production of hats and which country has a comparative advantage in the production of beer.
c. Suppose that Chile and Argentina currently do not trade with each other. Each has 1,000 hours of labor to use producing hats and beer, and the countries are currently producing the amounts of each good shown in the following table.
Hats | Beer (barrels) | |
Chile | 7,200 | 600 |
Argentina | 600 | 800 |
Using this information, give a numerical example of how Chile and Argentina can both gain from trade. Assume that after trading begins, one hat can be exchanged for one barrel of beer.
2) Chapter 8 Problem 1.11 (Related to solved Problem 8.1 around page 256)
Chapter 8 Problem 3.4 (Related to solved Problem 8.3 around page 265)
a. Suppose that a simple economy produces only four goods: shoes, hamburgers, shirts, and cotton. Assume that all the cotton is used in the production of shirts.
Use the information in the following table to calculate nominal GDP for 2019.
Production and Price Statistics for 2019 | ||
Product | Quantity | Price |
Shoes | 100 | $60.00 |
Hamburgers | 100 | $2.00 |
Shirts | 50 | $25.00 |
Cotton | 80 | $0.60 |
b. Now use the information in the table below to calculate real GDP for 2018 and 2019, assuming that the base year is 2009.
c. What is the growth rate of real GDP in during 2019?
2009 | 2018 | 2019 | ||||
Product | Quantity | Price | Quantity | Price | Quantity | Price |
Shoes | 90 | $50.00 | 100 | $60.00 | 100 | $65.00 |
Hamburgers | 75 | $2.00 | 100 | $2.00 | 120 | $2.25 |
Shirts | 50 | $30.00 | 50 | $25.00 | 65 | $25.00 |
Cotton | 100 | $0.80 | 800 | $0.60 | 120 | $0.70 |
3) Chapter 9 Problem 1.7
Fill in the missing values in the following table of data collected in the household survey for February 2017:
Working-Age Population | |
Employment | 152,528,000 |
Unemployment | |
Unemployment Rate | 4.7% |
Labor force | |
Labor force participation rate | 63.0% |
Employment-population ratio | |
Source: U.S. Department of Labor, Bureau of Labor Statistics, The Employment Situation - February 2017,March 10, 2017. |
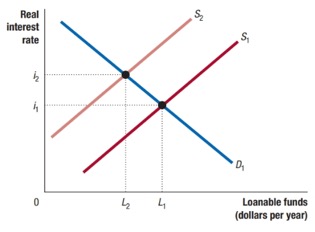
4) Chapter 10 Problem 2.11
Use the following graph to answer the questions.
Step by Step Solution
There are 3 Steps involved in it

Get step-by-step solutions from verified subject matter experts