

Question: Week seven homework 1. The table below represents possible production for one month of lumber and minerals in the UK and Australia. (measured in millions
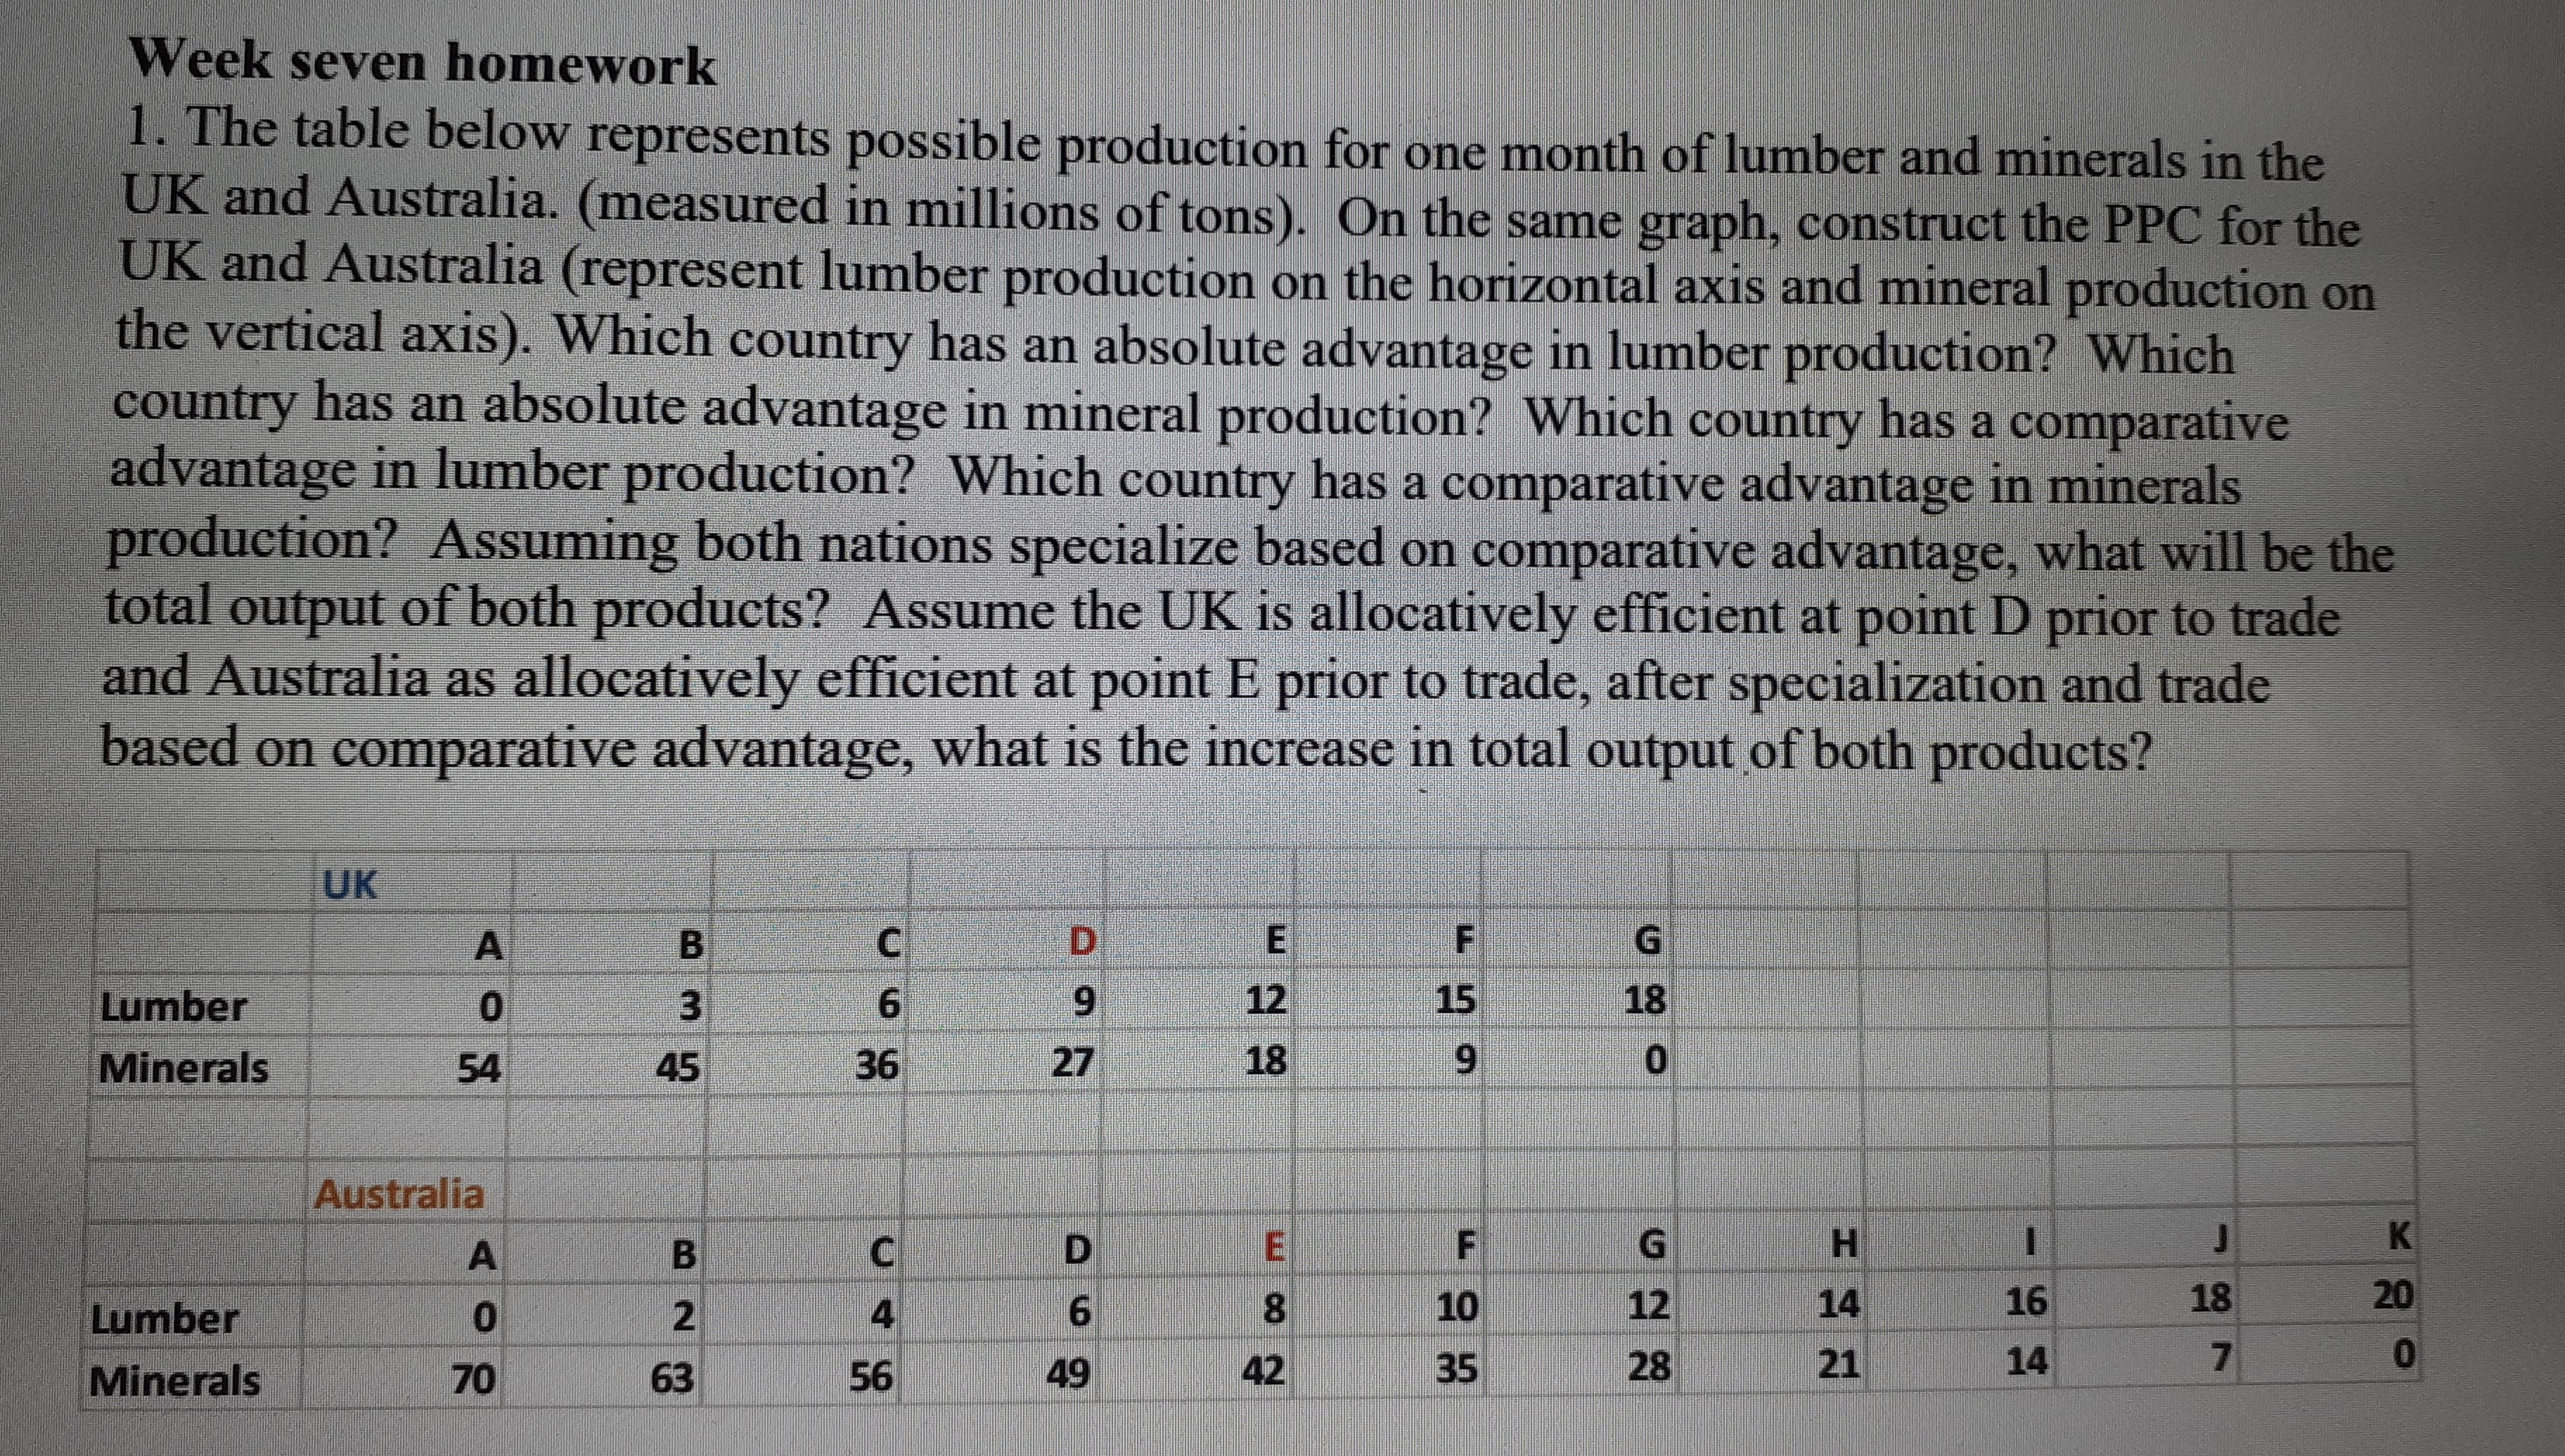
Week seven homework 1. The table below represents possible production for one month of lumber and minerals in the UK and Australia. (measured in millions of tons). On the same graph, construct the PPC for the UK and Australia (represent lumber production on the horizontal axis and mineral production on the vertical axis). Which country has an absolute advantage in lumber production? Which country has an absolute advantage in mineral production? Which country has a comparative advantage in lumber production? Which country has a comparative advantage in minerals production? Assuming both nations specialize based on comparative advantage, what will be the total output of both products? Assume the UK is allocation efficient at point D prior to trade and Australia as allocationy efficient at point E prior to trade, after specialization and trade based on comparative advantage, what is the increase in total output of both products? UK D E F G B 6 9 12 15 18 Lumber 0 3 36 27 18 9 0 Minerals 54 45 K Australia G H A B C D 16 18 20 6 8 10 12 14 O 2 Lumber 0 4 7 42 35 28 21 14 70 63 56 49 Minerals
Step by Step Solution
There are 3 Steps involved in it

Get step-by-step solutions from verified subject matter experts