Question: Week Two: Hands-on MIS Application Software Exercise Solution World Health Statistics This dataset is obtained from Census.gov, Sample Countries Data, and contains data by country
Week Two: Hands-on MIS Application Software Exercise Solution
World Health Statistics
This dataset is obtained from Census.gov, Sample Countries Data, and contains data by country for geographical area, population, military, health, Internet usage, HIV epidemic, development range (1 is the lowest) and more. The learning objectives are to quickly explore data, distill important information, and display in meaningful, easy-to-read tables and graphs.
- Import the file into Excel or Access (or your compatible application).
- Create new columns as necessary to complete the analysis.
- Perform the necessary steps (Sort/Filter/Pivot Table or Query/Report) to develop detailed answers for each question below:
- What are the countries with highest HIV epidemic?
- What is the healthiest country? What types of correlation can you see between less HIV infections and the countrys urbanization?
- What are the countries with highest life expectancy? What type of correlation can you see to describe the reason for high life expectancy in those countries?
- What are the countries with hi
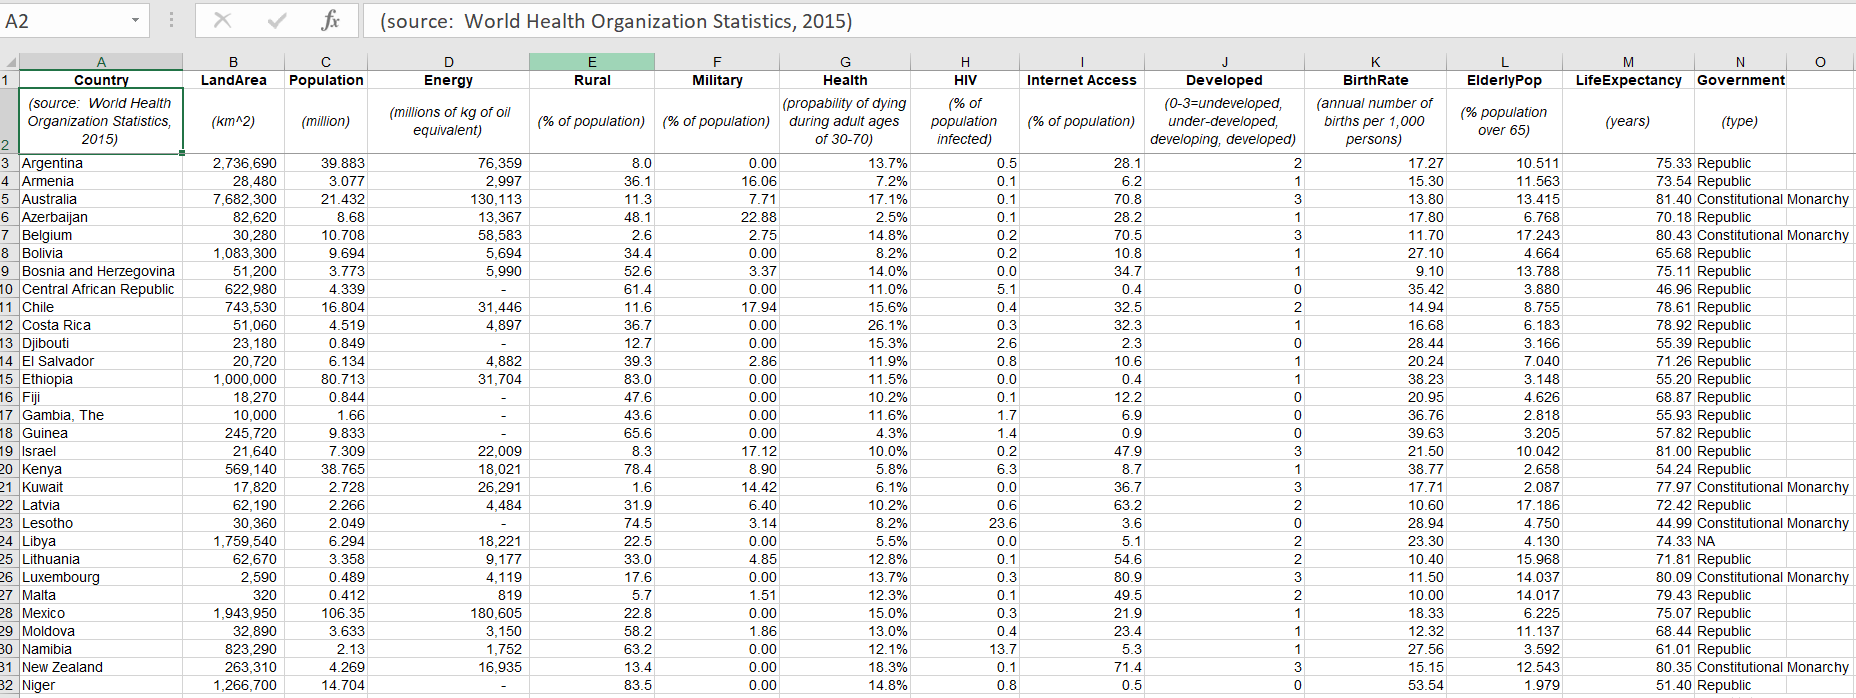
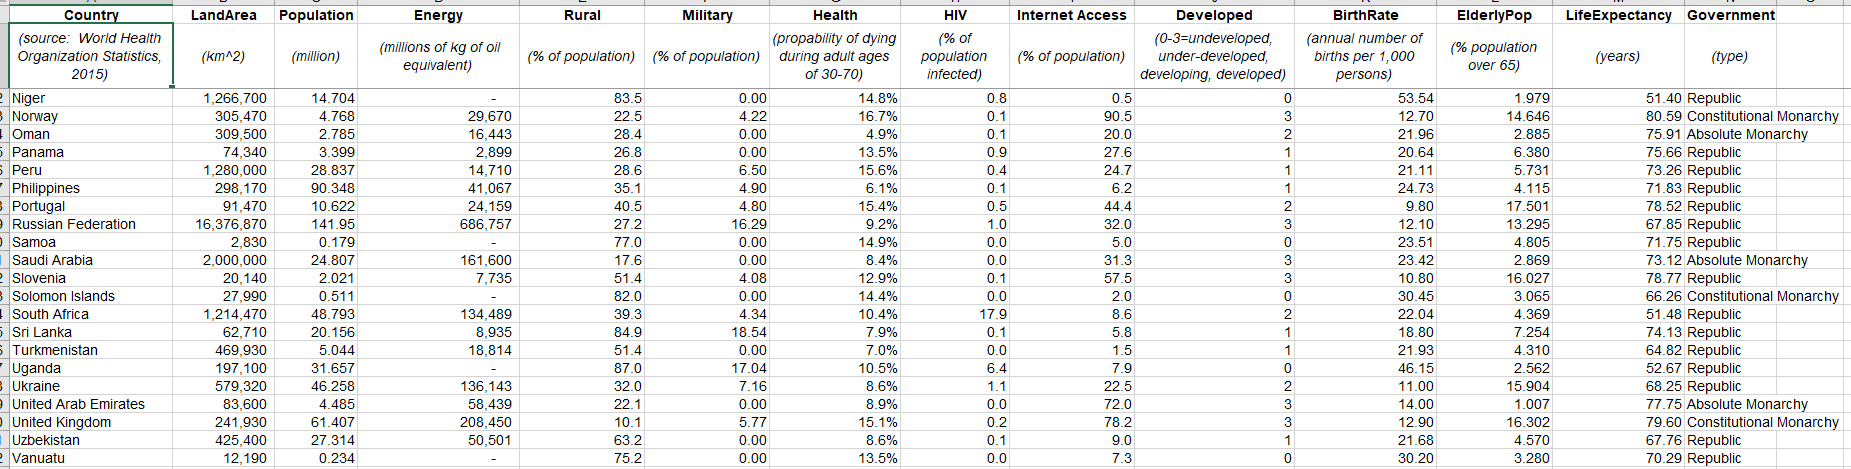 gh and low birth rate? Is birth rate higher or lower in the developed countries?
A2 : fx (source: World Health Organization Statistics, 2015) D - J 0 B Land Area Population L ElderlyPop M N Life Expectancy Government Energy H HIV (% of population infected) (km^2) (million) (millions of kg of oil equivalent) (% population over 65) (years) (type) 76,359 2.997 130,113 13,367 58,583 5.694 5,990 1 31,446 4,897 A 1 Country (source: World Health Organization Statistics, 2 2015) 3 Argentina 4 Armenia 5 Australia 6 Azerbaijan 7 Belgium 8 Bolivia 9 Bosnia and Herzegovina 10 Central African Republic 11 Chile 12 Costa Rica 13 Djibouti 14 El Salvador 15 Ethiopia 16 Fiji 17 Gambia, The 18 Guinea 19 Israel 20 Kenya 21 Kuwait 22 Latvia 23 Lesotho 24 Libya 25 Lithuania 26 Luxembourg 27 Malta 28 Mexico 29 Moldova 30 Namibia 31 New Zealand 32 Niger 4,882 31,704 2,736,690 28.480 7,682,300 82,620 30,280 1,083,300 51,200 622,980 743,530 51,060 23,180 20,720 1,000,000 18,270 10,000 245,720 21.640 569,140 17,820 62,190 30,360 1,759,540 62,670 2,590 320 1,943,950 32,890 823,290 263,310 1,266,700 E F G Rural Military Health (propability of dying (% of population) (% of population) during adult ages of 30-70) 8.0 0.00 13.7% 36.1 16.06 7.2% 11.3 7.71 17.1% 48.1 22.88 2.5% 2.6 2.75 14.8% 34.4 0.00 8.2% 52.6 3.37 14.0% 61.4 0.00 11.0% 11.6 17.94 15.6% 36.7 0.00 26.1% 12.7 0.00 15.3% 39.3 2.86 11.9% 83.0 0.00 11.5% 47.6 0.00 10.2% 43.6 0.00 11.6% 65.6 0.00 4.3% 8.3 17.12 10.0% 78.4 8.90 5.8% 1.6 14.42 6.1% 31.9 6.40 10.2% 74.5 3.14 8.2% 22.5 0.00 5.5% 33.0 4.85 12.8% 17.6 0.00 13.7% 5.7 1.51 12.3% 22.8 0.00 15.0% 58.2 1.86 13.0% 63.2 0.00 12.1% 13.4 0.00 18.3% 83.5 0.00 14.8% 39.883 3.077 21.432 8.68 10.708 9.694 3.773 4.339 16.804 4.519 0.849 6.134 80.713 0.844 1.66 9.833 7.309 38.765 2.728 2.266 2.049 6.294 3.358 0.489 0.412 106.35 3.633 2.13 4.269 14.704 1 Internet Access Developed (0-3=undeveloped, (% of population) under-developed, developing, developed) 28.1 2 6.2 1 70.8 3 28.2 70.5 3 10.8 1 34.7 1 0.4 0 32.5 2 32.3 1 2.3 0 10.6 1 0.4 12.2 0 6.9 0 0.9 0 47.9 3 8.7 1 36.7 3 63.2 2 3.6 0 5.1 2 54.6 2 80.9 3 49.5 2 21.9 23.4 1 5.3 1 71.4 3 0.5 0 0.5 0.1 0.1 0.1 0.2 0.2 0.0 5.1 0.4 0.3 2.6 0.8 0.0 0.1 1.7 1.4 0.2 6.3 0.0 0.6 23.6 0.0 0.1 0.3 0.1 0.3 0.4 13.7 0.1 0.8 K BirthRate (annual number of births per 1,000 persons) 17.27 15.30 13.80 17.80 11.70 27.10 9.10 35.42 14.94 16.68 28.44 20.24 38.23 20.95 36.76 39.63 21.50 38.77 17.71 10.60 28.94 23.30 10.40 11.50 10.00 18.33 12.32 27.56 15.15 53.54 10.511 11.563 13.415 6.768 17.243 4.664 13.788 3.880 8.755 6.183 3.166 7.040 3.148 4.626 2.818 3.205 10.042 2.658 2.087 17.186 4.750 4.130 15.968 14.037 14.017 6.225 11.137 3.592 12.543 1.979 75.33 Republic 73.54 Republic 81.40 Constitutional Monarchy 70.18 Republic 80.43 Constitutional Monarchy 65.68 Republic 75.11 Republic 46.96 Republic 78.61 Republic 78.92 Republic 55.39 Republic 71.26 Republic 55.20 Republic 68.87 Republic 55.93 Republic 57.82 Republic 81.00 Republic 54.24 Republic 77.97 Constitutional Monarchy 72.42 Republic 44.99 Constitutional Monarchy 74.33 NA 71.81 Republic 80.09 Constitutional Monarchy 79.43 Republic 75.07 Republic 68.44 Republic 61.01 Republic 80.35 Constitutional Monarchy 51.40 Republic 22,009 18,021 26,291 4.484 18,221 9,177 4,119 819 180,605 3,150 1,752 16,935 1 Land Area Population Energy Internet Access ElderlyPop Life Expectancy Government (km^2) (million) (millions of kg of oil equivalent) (% of population) (% population over 65) (years) (type) 29,670 16,443 2,899 14,710 41,067 24,159 686,757 Country (source: World Health Organization Statistics, 2015) - Niger B Norway 1 Oman 5 Panama 5 Peru - Philippines Portugal Russian Federation Samoa Saudi Arabia Slovenia Solomon Islands South Africa Sri Lanka Turkmenistan Uganda Ukraine United Arab Emirates United Kingdom Uzbekistan Vanuatu 1,266,700 305,470 309,500 74,340 1,280,000 298,170 91,470 16,376,870 2.830 2,000,000 20,140 27,990 1,214,470 62,710 469,930 197,100 579,320 83,600 241,930 425,400 12,190 14.704 4.768 2.785 3.399 28.837 90.348 10.622 141.95 0.179 24.807 2.021 0.511 48.793 20.156 5.044 31.657 46.258 4.485 61.407 27.314 0.234 Rural Military Health (propability of dying (% of population) (% of population) during adult ages of 30-70) 83.5 0.00 14.8% 22.5 4.22 16.7% 28.4 0.00 4.9% 26.8 0.00 13.5% 28.6 6.50 15.6% 35.1 4.90 6.1% 40.5 4.80 15.4% 27.2 16.29 9.2% 77.0 0.00 14.9% 17.6 0.00 8.4% 51.4 4.08 12.9% 82.0 0.00 14.4% 39.3 4.34 10.4% 84.9 18.54 7.9% 51.4 0.00 7.0% 87.0 17.04 10.5% 32.0 7.16 8.6% 22.1 0.00 8.9% 10.1 5.77 15.1% 63.2 0.00 8.6% 75.2 0.00 13.5% HIV (% of population infected) 0.8 0.1 0.1 0.9 0.4 0.1 0.5 1.0 0.0 0.0 0.1 0.0 17.9 0.1 0.0 6.4 1.1 0.0 0.2 0.1 0.0 Developed (0-3=undeveloped under-developed, developing, developed) 0 3 2 1 1 1 2 3 0 3 3 0 2 0.5 90.5 20.0 27.6 24.7 6.2 44.4 32.0 5.0 31.3 57.5 2.0 8.6 5.8 1.5 7.9 22.5 72.0 78.2 9.0 7.3 BirthRate (annual number of births per 1,000 persons) 53.54 12.70 21.96 20.64 21.11 24.73 9.80 12.10 23.51 23.42 10.80 30.45 22.04 18.80 21.93 46.15 11.00 14.00 12.90 21.68 30.20 161,600 7,735 1.979 14.646 2.885 6.380 5.731 4.115 17.501 13.295 4.805 2.869 16.027 3.065 4.369 7.254 4.310 2.562 15.904 1.007 16.302 4.570 3.280 51.40 Republic 80.59 Constitutional Monarchy 75.91 Absolute Monarchy 75.66 Republic 73.26 Republic 71.83 Republic 78.52 Republic 67.85 Republic 71.75 Republic 73.12 Absolute Monarchy 78.77 Republic 66.26 Constitutional Monarchy 51.48 Republic 74.13 Republic 64.82 Republic 52.67 Republic 68.25 Republic 77.75 Absolute Monarchy 79.60 Constitutional Monarchy 67.76 Republic 70.29 Republic 134,489 8,935 18,814 1 1 0 136, 143 58,439 208,450 50,501 2 3 3 1 0


