

Question: Weeks Actual Demand Forecast Week 1 Week 2 Week 3 73 70 68 73 82 72 10% Practice 3 Week 4 Week 5 Week 6
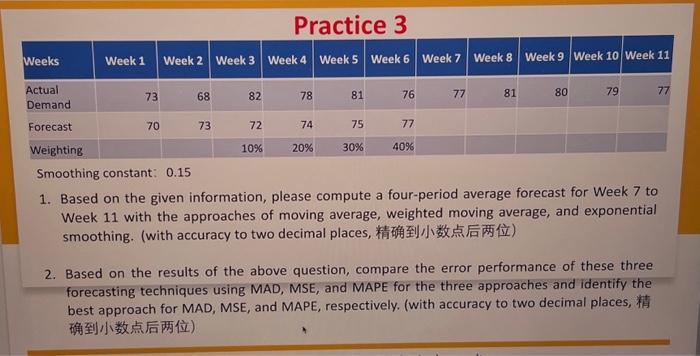
Weeks Actual Demand Forecast Week 1 Week 2 Week 3 73 70 68 73 82 72 10% Practice 3 Week 4 Week 5 Week 6 Week 7 Week 8 Week 9 Week 10 Week 11 78 74 20% 81 75 30% 76 77 40% 77 81 80 79 77 Weighting Smoothing constant: 0.15 1. Based on the given information, please compute a four-period average forecast for Week 7 to Week 11 with the approaches of moving average, weighted moving average, and exponential smoothing. (with accuracy to two decimal places, ) 2. Based on the results of the above question, compare the error performance of these three forecasting techniques using MAD, MSE, and MAPE for the three approaches and identify the best approach for MAD, MSE, and MAPE, respectively. (with accuracy to two decimal places, )
Practice 3 Smoothing constant: 0.15 1. Based on the given information, please compute a four-period average forecast for Week 7 to Week 11 with the approaches of moving average, weighted moving average, and exponential smoothing. (with accuracy to two decimal places, ) 2. Based on the results of the above question, compare the error performance of these three forecasting techniques using MAD, MSE, and MAPE for the three approaches and identify the best approach for MAD, MSE, and MAPE, respectively. (with accuracy to two decimal places, )
Step by Step Solution
There are 3 Steps involved in it
1 Expert Approved Answer
Step: 1 Unlock

Question Has Been Solved by an Expert!
Get step-by-step solutions from verified subject matter experts
Step: 2 Unlock
Step: 3 Unlock