

Question: Welcom to Uno's Pizzerial complete the table and make a graph of Price, MC, ATC (dollars on vertical y axis: Qty of cooks on horizontal
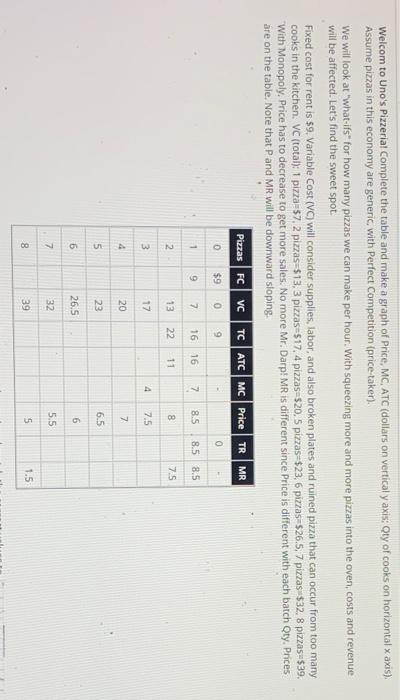
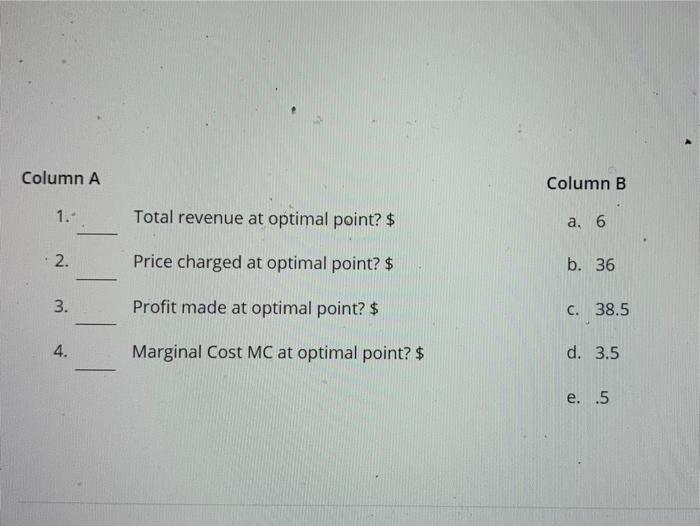
Welcom to Uno's Pizzerial complete the table and make a graph of Price, MC, ATC (dollars on vertical y axis: Qty of cooks on horizontal x axis), Assume pizzas in this economy are generic with Perfect Competition (price taker). We will look at 'what-ifs" for how many pizzas we can make per hour. With squeezing more and more pizzas into the oven, costs and revenue will be affected. Let's find the sweet spot. Fixed cost for rent is $9. Variable Cost (VC) will consider supplies, labor, and also broken plates and ruined pizza that can occur from too many cooks in the kitchen. VC (total): 1 pizza-57.2 pizzas=$13,3 pizzas=517,4 pizzas-$20,5 pizzas=$23, 6 pizzas $26.5, 7 pizzas-$32. 8 pizzas $39. With Monopoly. Price has to decrease to get more sales. No more Mr. Darp! MR is different since Price is different with each batch Qty. Prices are on the table. Note that P and MR will be downward sloping. Pizzas FC VC TC ATC MC Price TR MR $909 9 7 16 16 8.5 8.5 8.5 0 - 1 7 2 13 22 11 8 75 3 17 7.5 20 7 7 5 23 6.5 6 26.5 6 7 7 32 5.5 8 39 5 1.5 Column A Column B 1. Total revenue at optimal point? $ a, 6 2. Price charged at optimal point? $ b. 36 3. Profit made at optimal point? $ c. 38.5 - 4. . Marginal Cost MC at optimal point? $ d. 3.5 e. .5
Step by Step Solution
There are 3 Steps involved in it

Get step-by-step solutions from verified subject matter experts