

Question: Welfare Table analysis help PROBLEM #6 The graph below represents the labor market in a city. The city is considering establishing a minimum wage of
Welfare Table analysis help
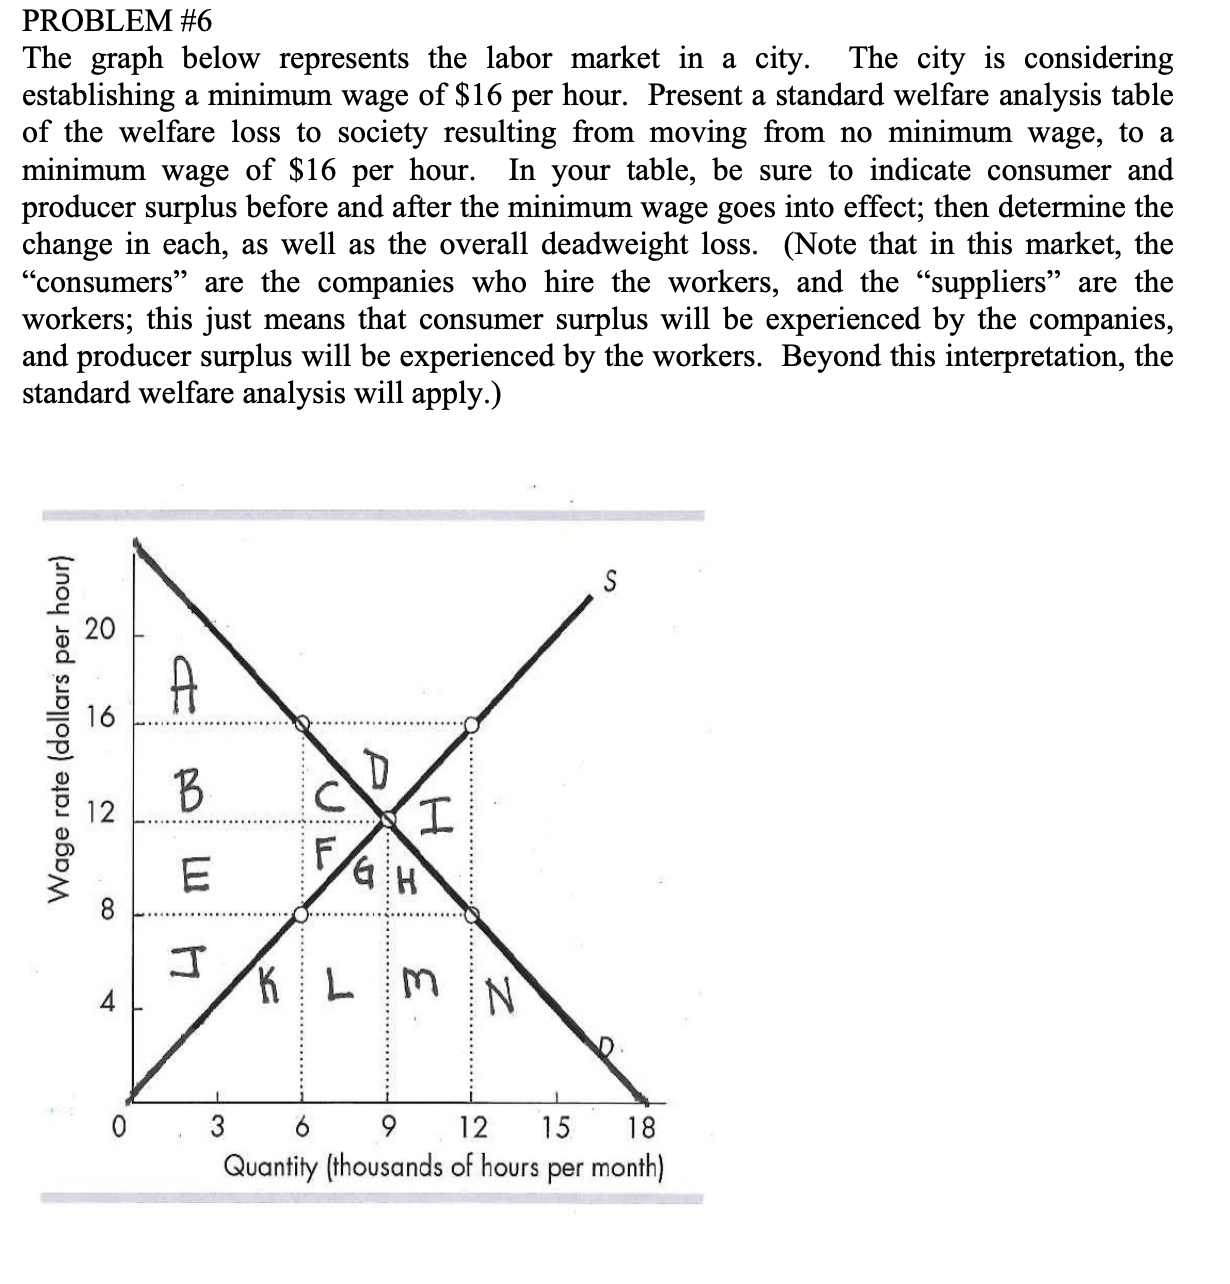
PROBLEM #6 The graph below represents the labor market in a city. The city is considering establishing a minimum wage of $16 per hour. Present a standard welfare analysis table of the welfare loss to society resulting from moving from no minimum wage, to a minimum wage of $16 per hour. In your table, be sure to indicate consumer and producer surplus before and after the minimum wage goes into effect; then determine the change in each, as well as the overall deadweight loss. (Note that in this market, the \"consumers\" are the companies who hire the workers, and the \"suppliers\" are the workers; this just means that consumer surplus will be experienced by the companies, and producer surplus will be experienced by the workers. Beyond this interpretation, the standard welfare analysis will apply.) H O 0* Ix) Wage rate (dollars per hour] 0.3 6 9121513 Quonly (thousands of hours per month)
Step by Step Solution
There are 3 Steps involved in it

Get step-by-step solutions from verified subject matter experts