

Question: well performance in petroleum engineering 1.1 A buildup test was conducted on an oil well. The well was produced for an effective time of 180

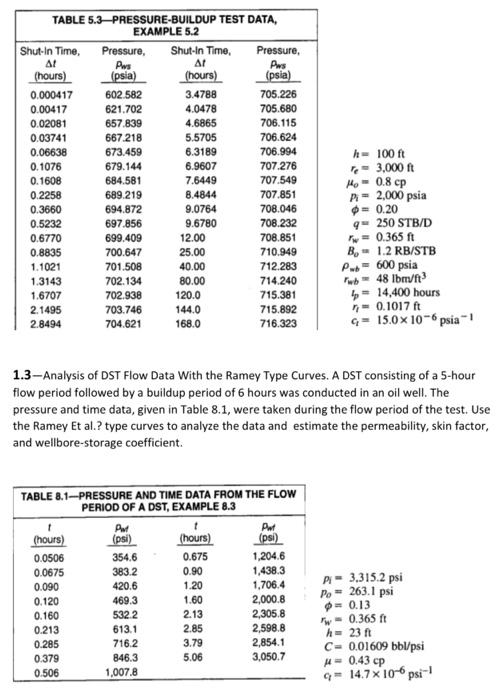
1.1 A buildup test was conducted on an oil well. The well was produced for an effective time of 180 days at the final rate. The buildup and other pertinent reservoir data are: q0=350STB/day,B0=1.136bbl/STB,h=49ft,=0.23,rw= 0.29ft,ct=17106,o=0.8cp,A=11.55 acres, pwar(t=0)= 3561 pst. tp=180 day. The attached table shows the pressure buildup and calculated data. Assuming the well is in the center of a closed square, determine the formation permeability and skin factor using Horner plot and MDH methods. 1.2 Bulldup Test With Wellbore Phase Redistribution, Type 2 Pressure Response. A pressure buildup test was run on an oil well completed with 2.875-in. tubing inside 7.625-in. casing. Table 5.3 gives pressure and time data, Other known data are summarized next. Estimate formation permeability, skin factor, Productivity ratio, the wellbore-storage coefficient, Damage Ratio. 1.3-Analysis of DST Flow Data With the Ramey Type Curves. A DST consisting of a 5-hour flow period followed by a buildup period of 6 hours was conducted in an oil well. The pressure and time data, given in Table 8.1, were taken during the flow period of the test. Use the Ramey Et al.? type curves to analyze the data and estimate the permeability, skin factor, and wellbore-storage coefficient
Step by Step Solution
There are 3 Steps involved in it

Get step-by-step solutions from verified subject matter experts