

Question: We're having some issues figuring out how to find our break-even point with the assigned formula. See the attached screenshot for our numbers. ASSIGNMENT F:
We're having some issues figuring out how to find our break-even point with the assigned formula. See the attached screenshot for our numbers.
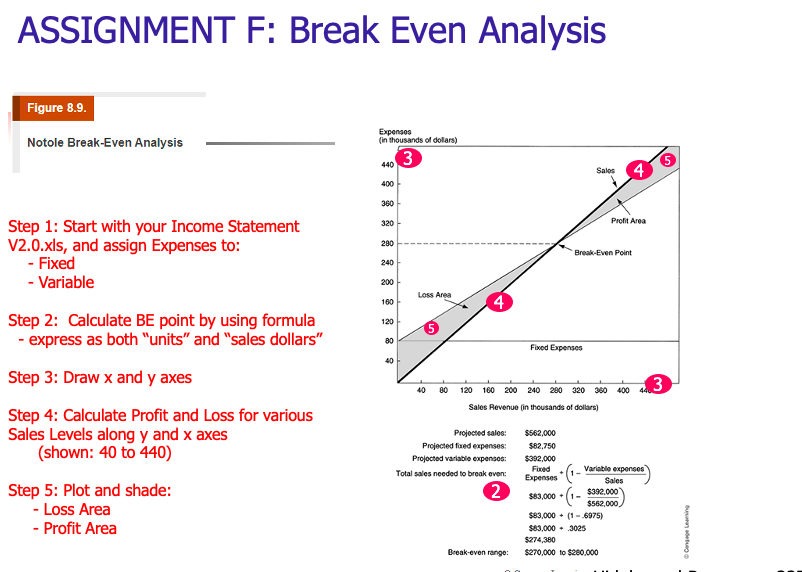
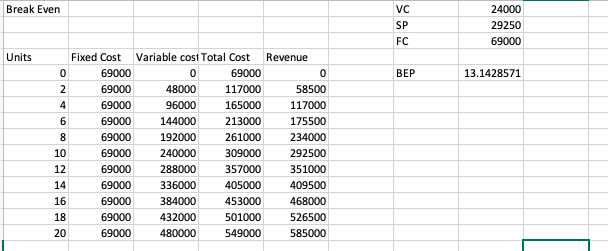
ASSIGNMENT F: Break Even Analysis Figure 8.9. Notole Break-Even Analysis Expenses in thousands of dolars) 440 3 Sales 4 400 360 320 Profit Area 280 Step 1: Start with your Income Statement V2.0.xls, and assign Expenses to: - Fixed - Variable Break-Even Point 240 200 Loss Area 160 120 5 80 Fixed Expenses 40 Step 2: Calculate BE point by using formula - express as both "units" and "sales dollars" Step 3: Draw x and y axes Step 4: Calculate Profit and Loss for various Sales Levels along y and x axes (shown: 40 to 440) 40 80 3 120 160 200 240 200 320 350 400 44. Sales Revenue in thousands of dollars) Projected sales: Projected foed expenses Projected variable expenses: Total sales needed to break even: 2 $562,000 $82.750 $392,000 Fixed Variable expenses Expenses Sales $83,000 $390.000 $562,000 $83,000 + (1 - 6975) $83,000 3025 $274,380 $270,000 to $280.000 Step 5: Plot and shade: - Loss Area - Profit Area .(- gering Break-even range: Break Even VC SP FC 24000 29250 69000 Units BEP 13.1428571 Fixed Cost Variable cost Total Cost Revenue 69000 0 69000 0 69000 48000 117000 58500 4 69000 96000 165000 117000 69000 144000 213000 175500 69000 192000 261000 234000 10 69000 240000 309000 292500 12 69000 288000 357000 351000 14 69000 336000 405000 409500 16 69000 384000 453000 468000 18 69000 432000 501000 526500 20 69000 480000 549000 585000 6 6600 NO ASSIGNMENT F: Break Even Analysis Figure 8.9. Notole Break-Even Analysis Expenses in thousands of dolars) 440 3 Sales 4 400 360 320 Profit Area 280 Step 1: Start with your Income Statement V2.0.xls, and assign Expenses to: - Fixed - Variable Break-Even Point 240 200 Loss Area 160 120 5 80 Fixed Expenses 40 Step 2: Calculate BE point by using formula - express as both "units" and "sales dollars" Step 3: Draw x and y axes Step 4: Calculate Profit and Loss for various Sales Levels along y and x axes (shown: 40 to 440) 40 80 3 120 160 200 240 200 320 350 400 44. Sales Revenue in thousands of dollars) Projected sales: Projected foed expenses Projected variable expenses: Total sales needed to break even: 2 $562,000 $82.750 $392,000 Fixed Variable expenses Expenses Sales $83,000 $390.000 $562,000 $83,000 + (1 - 6975) $83,000 3025 $274,380 $270,000 to $280.000 Step 5: Plot and shade: - Loss Area - Profit Area .(- gering Break-even range: Break Even VC SP FC 24000 29250 69000 Units BEP 13.1428571 Fixed Cost Variable cost Total Cost Revenue 69000 0 69000 0 69000 48000 117000 58500 4 69000 96000 165000 117000 69000 144000 213000 175500 69000 192000 261000 234000 10 69000 240000 309000 292500 12 69000 288000 357000 351000 14 69000 336000 405000 409500 16 69000 384000 453000 468000 18 69000 432000 501000 526500 20 69000 480000 549000 585000 6 6600 NO
Step by Step Solution
There are 3 Steps involved in it

Get step-by-step solutions from verified subject matter experts