

Question: Wesfarmers annual report can be accessed using this link and click on the year for which you want to access the report and then from
Wesfarmers annual report can be accessed using this link and click on the year for which you want to access the report and then from the drop down select the annual report for that particular year : https://www.wesfarmers.com.au/investor-centre/company-performance-news/reports
QUES: Do the horizontal analysis, which is comparing current, quick and cash flow ratio numbers. Analyse every ratio in short sentences, is it increasing or decreasing, what does the increase or decrease mean in terms of liquidity stating what caused the increase or decrease?
QUES: Do analysis of the Liquidity of the company over the 5 years?
Provide some recommendations for the company?
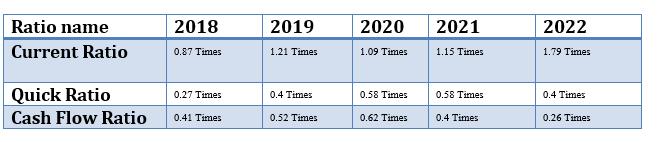
Prepare graphs of trends? ALREADY SOLVED, please refer to the below screenshot for framing answer to question 1,2 and 3

Ratio name Current Ratio Quick Ratio Cash Flow Ratio 2018 0.87 Times 0.27 Times 0.41 Times 2019 1.21 Times 0.4 Times 0.52 Times 2020 1.09 Times 0.58 Times 0.62 Times 2021 1.15 Times 0.58 Times 0.4 Times 2022 1.79 Times 0.4 Times 0.26 Times
Step by Step Solution
3.33 Rating (159 Votes )
There are 3 Steps involved in it
Here are the detailed calculations for the liquidity ratios from 20182022 Current Ratio 2018 Current ... View full answer

Get step-by-step solutions from verified subject matter experts