Question: . . West Read Ch. 5 Exercise 2 Drylce, Inc. in the textbook Assume that the company now faces the increased demand below (instead of
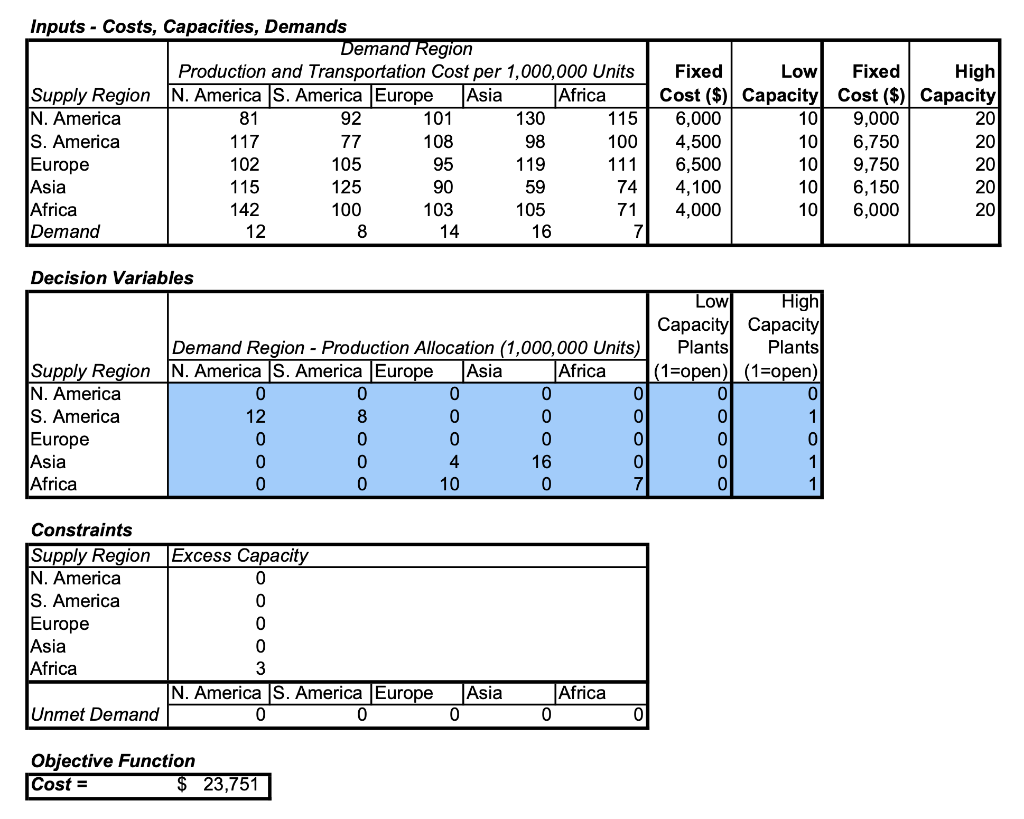
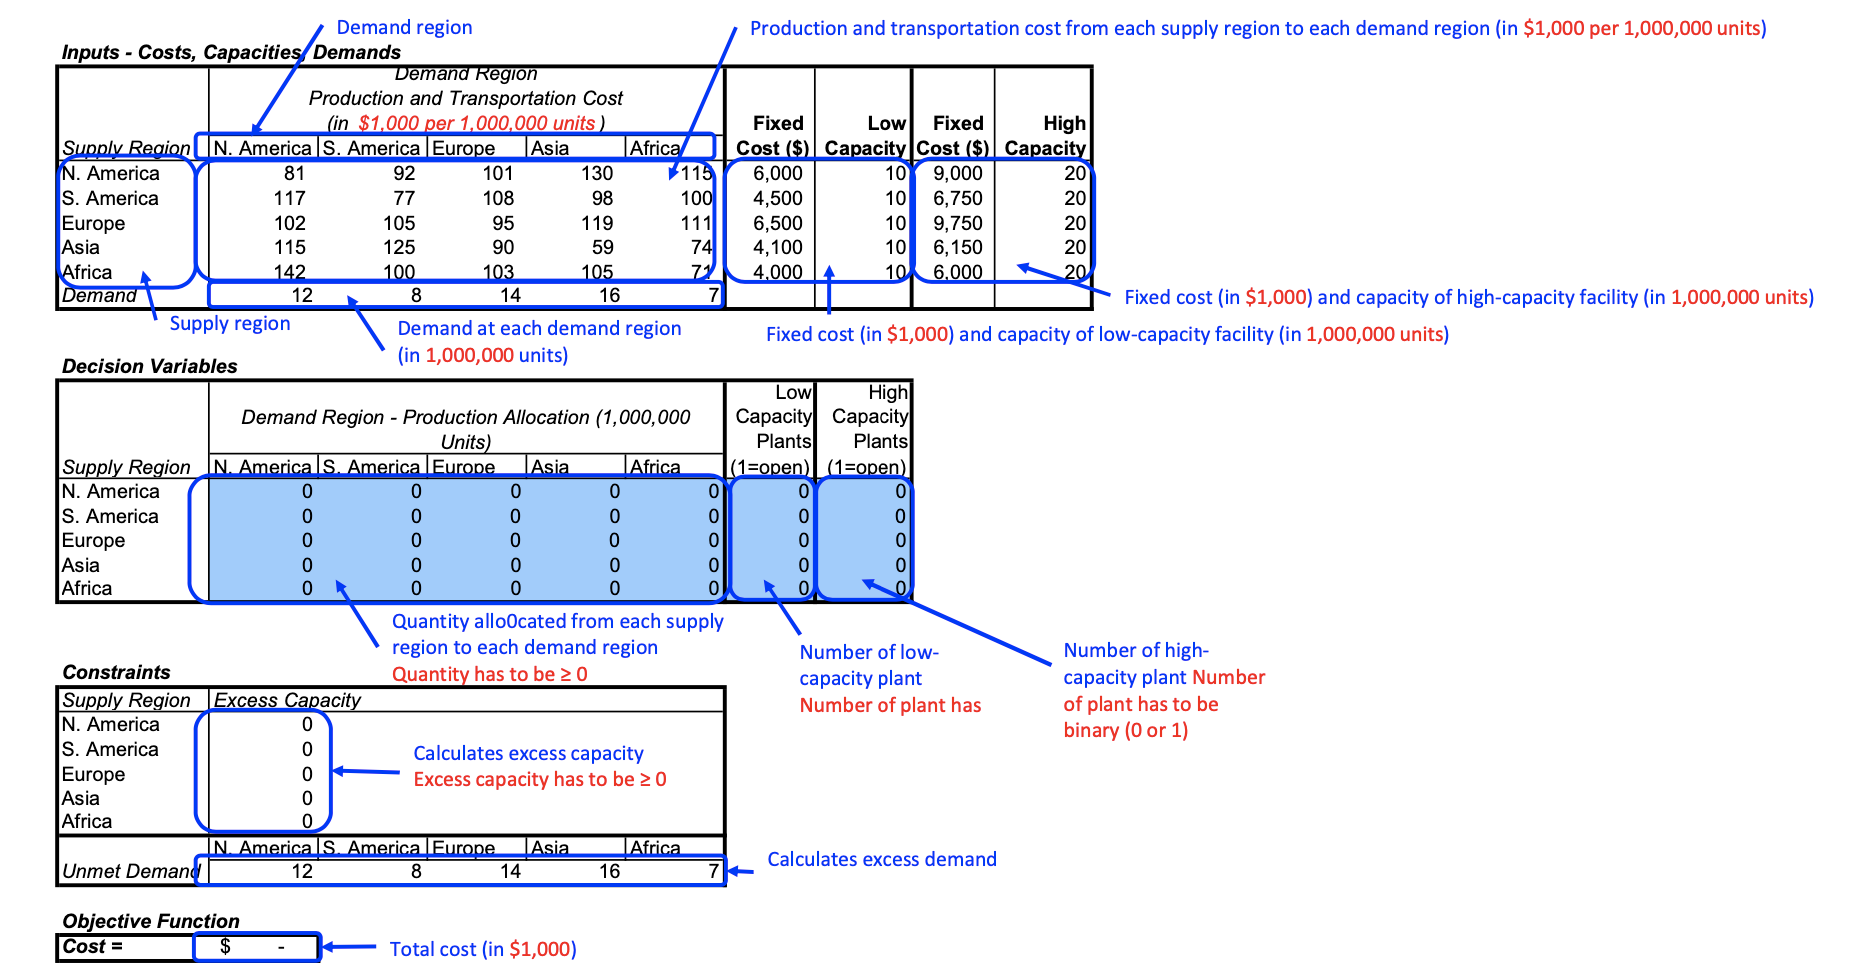
. . West Read Ch. 5 Exercise 2 Drylce, Inc. in the textbook Assume that the company now faces the increased demand below (instead of the demand described in the original problem) New demand at each market region East : 400,000 South : 800,000 Midwest : 300,000 : 200,000 Production costs, transport costs, and fixed costs of plants are same as those in Table 5-5 in the textbook Questions (1-1) Where should Drylce build its plants and how large should they be? (1-2) How much units should Drylce transport to each market region from each plant? Submit Excel file with answers and all necessary conditions for Solver to run optimization - so that Solver models can be checked . . . Modify the provided Excel template for the assignment Enter the data of the problem in the template in the unit of: $1,000 for facility cost $ per unit for cost of air conditioner (sum of production and transport costs) 1,000 units for demand and plant capacity For example: Fixed cost of New York 200,000-capacity plant would be $6,000 instead of $6,000,000 Demand in South would be 180 instead of 180,000 In Solver, change the ranges of: Variables in By Changing Variable Cells:" box Constraints in Subject to the Constraints:" box because the number of markets and the number of production sites are different from the template . . . Inputs - Costs, Capacities, Demands Demand Region Production and Transportation Cost per 1,000,000 Units Supply Region N. America S. America Europe Asia Africa N. America 81 92 101 130 115 S. America 117 77 108 98 100 Europe 102 105 95 119 111 Asia 115 125 90 59 74 Africa 142 100 103 105 71 Demand 12 8 14 16 7 Fixed Low Fixed High Cost ($) Capacity Cost ($) Capacity 6,000 10 9,000 20 4,500 10 6,750 20 6,500 10 9,750 20 4,100 10 6,150 20 4,000 10 6,000 20 Decision Variables Demand Region - Production Allocation (1,000,000 Units) Supply Region N. America S. America Europe Asia Africa N. America 0 0 0 0 0 S. America 12 0 0 0 Europe 0 0 0 Asia 4 16 Africa 10 0 Low High Capacity Capacity Plants Plants (1=open) (1=open) 0 0 0 1 0 0 1 O OOONO OOOO Constraints Supply Region Excess Capacity N. America S. America Europe Asia Africa N. America S. America Europe Unmet Demand 0 0 0000 Asia 0 |Africa 0 Objective Function Cost = $ 23,751 88888 142 Demand region Production and transportation cost from each supply region to each demand region (in $1,000 per 1,000,000 units) Inputs - Costs, Capacities Demands Demand Region Production and Transportation Cost (in $1,000 per 1,000,000 units) Fixed Low Fixed High Supply Region N. America S. America Europe Asia Africa Cost ($) Capacity Cost ($) Capacity IN. America 81 92 101 130 115 6,000 10 9,000 20 S. America 117 77 108 98 100 4,500 10 6,750 20 Europe 102 105 95 119 111 6,500 10 9,750 20 Asia 115 125 90 59 74 4,100 10 6,150 20 Africa 100 103 105 7 4.000 10 6.000 20 Demand 12 8 14 16 7 Fixed cost (in $1,000) and capacity of high-capacity facility (in 1,000,000 units) Supply region Demand at each demand region Fixed cost (in $1,000) and capacity of low-capacity facility (in 1,000,000 units) (in 1,000,000 units) Decision Variables Low High Demand Region - Production Allocation (1,000,000 Capacity Capacity Units) Plants Plants Supply Region IN. America S. America Europe Asia Africa (1=open) (1=open) N. America 0 S. America 0 Europe 0 0 Asia 0 Africa 0 0 0 Quantity alloOcated from each supply region each demand region Number of low- Number of high- Constraints Quantity has to be 20 capacity plant capacity plant Number Supply Region Excess Capacity Number of plant has of plant has to be N. America binary (0 or 1) S. America Calculates excess capacity Europe Excess capacity has to be 20 Asia Africa 0 IN Americals. America Europe Asia Africa Calculates excess demand Unmet Demand 12 8 14 16 7 OOOO O O O OOOO Objective Function Cost = $ Total cost (in $1,000)


