

Question: What am I doing wrong this is all that I'm getting # Create a histogram of the finish time for all runners. Make sure to
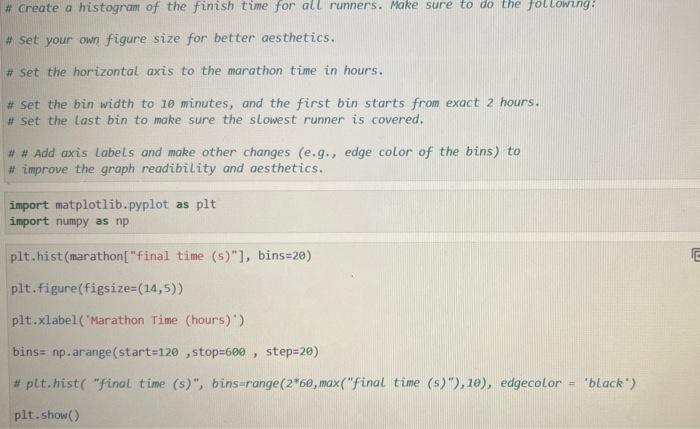
\# Create a histogram of the finish time for all runners. Make sure to do the followng: \# Set your own figure size for better aesthetics. \# Set the horizontal axis to the marathon time in hours. \# Set the bin width to 10 minutes, and the first bin starts from exact 2 hours. " Set the last bin to make sure the slowest runner is covered. \# \# Add axis labels and make other changes (e.g., edge color of the bins) to \# improve the graph readibility and aesthetics. import matplotlib.pyplot as plt import numpy as np plt. hist (marathon[ "final time (s)" ], bins=20) plt. figure(figsize =(14,5)) plt.xlabel("Marathon Time (hours)") bins =np arange (sstart=120, stop =600, step =20) "plt.hist( "final time (s)", bins-range(2*60, max ("final time (s)"), 1e), edgecolor = "black") plt. show ()
Step by Step Solution
There are 3 Steps involved in it

Get step-by-step solutions from verified subject matter experts