

Question: What analysis can be given to the spread sheet below provides clear communication that explains capital budgeting concepts, tools, applications, and your specific capital budgeting
What analysis can be given to the spread sheet below provides clear communication that explains capital budgeting concepts, tools, applications, and your specific capital budgeting analysis, including items noted below. Your communication and Word report should be of the quality that you would be proud to submit to your Board of Directors or investors (or other clients) regarding your firm's capital budgeting processes and your analysis of this case. The reports (Word & PPT) should have a table of contents (Word) and agenda (PPT) for all the appropriate sections, and should NOT address the items below in an "A, B, C... " format, but rather integrate the items into the report and the sections as appropriate.: How does CFs are modeled along with the complete CF Model for the project; the key capital budgeting decision tools, how they are computed, their pros & cons, and how they are used to make a decision regarding projects; an NPV Profile and discussion of the NPV profile.. In addition to the thorough overview of the capital budgeting process, tools, techniques, and key terms in general, your Word report and PPT should provide specific information regarding the case analysis, such as input data/assumptions, cash flow modeling (tables to illustrate), analysis & decision tools applications and results (tables of results), NPV Profile and discussion, etc.
2B. A glossary of capital budgeting concepts and terms (alphabetical) with definitions and comments regarding the implications of the concepts. Within your review of capital budgeting key concepts, processes and applications. At a minimum, the key concepts and terms should include: ? ATSV, ? Cash flow analysis (time zero initial investment cash flows, operating life cash flows, terminal period end of project cash flows), ? cash flow timeline, ? conventional cash flow stream, non-conventional cash flow stream, ? discount rate & cost of capital concept (and implications to valuation) ? independent projects, ? IRR - multiple IRRs, ? IRR, ? mutually exclusive projects, ? NPV = 0 meaning and implications, ? NPV Profile, ? NPV, ? opportunity cost, ? Payback Period, ? profitability index, ? ranking conflict of NPV vs. IRR, ? sunk cost,
2C. REMINDER: As noted in 2A, thoroughly address your capital budgeting analysis, including tables and graphs illustrating the analysis and the results of the analysis.
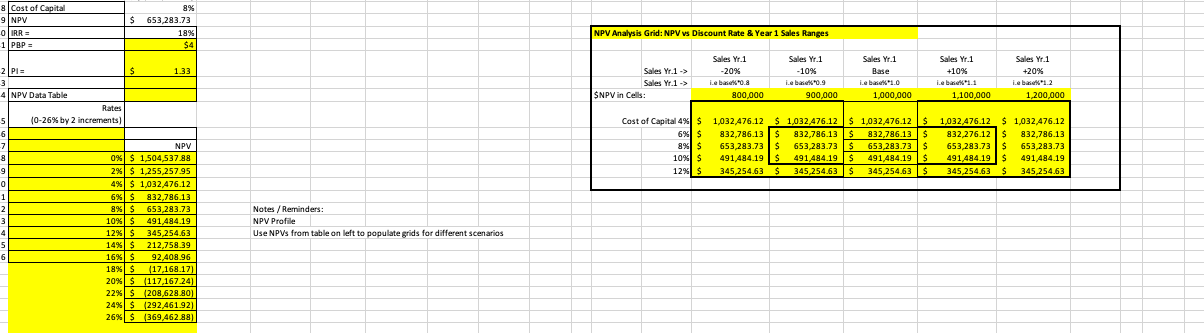
8 Cost of Capital 9 NPV -0 IRR = -1 PBP = 2 Pl= 3 4 NPV Data Table 5 6 -7 8 9 0 1 2 3 4 5 6 Rates (0-26% by 2 increments) 8% $ 653,283.73 18% $4 $ 1.33 NPV 0% $1,504,537.88 2% $1,255,257.95 4% $ 1,032,476.12 6% $ 832,786.13 8% $ 653,283.73 10% $ 491,484.19 12% $ 345,254.63 14% $ 212,758.39 16% $ 92,408.96 18% $ (17,168.17) 20% $(117,167.24) 22% $ (208,628.80) 24% $(292,461.92) 26% $ (369,462.88) Notes / Reminders: NPV Profile Use NPVs from table on left to populate grids for different scenarios NPV Analysis Grid: NPV vs Discount Rate & Year 1 Sales Ranges Sales Yr.1 -20% i.ebase*0.8 Sales Yr.1 -> Sales Yr.1 -> SNPV in Cells: Cost of Capital 4% $ 6% $ 8% $ 10% $ 12% $ 800,000 Sales Yr.1 -10% i.ebase*0.9 900,000 Sales Yr.1 Base i.eba 1.0 1,000,000 Sales Yr.1 +10% i.ebase 1.1 1,100,000 Sales Yr.1 +20% i.ebase%*1.2 1,200,000 1,032,476.12 $ 1,032,476.12 $ 1,032,476.12 $ 1,032476.12 $ 1,032,476.12 832,786.13 $ 832,786.13 $ 832,786.13 $ 832,276.12 $ 832,786.13 653,283.73 $ 653,283.73 $ 653,283.73 $ 653,283.73 $ 653,283.73 491.484.19 $ 491,484.19 $ 491,484.19 $ 491,484.19 $ 491,484.19 345.254.63 $ 345,254.63 $ 345,254.63 $ 345,254.63 $ 345,254.63
Step by Step Solution
There are 3 Steps involved in it

Get step-by-step solutions from verified subject matter experts