

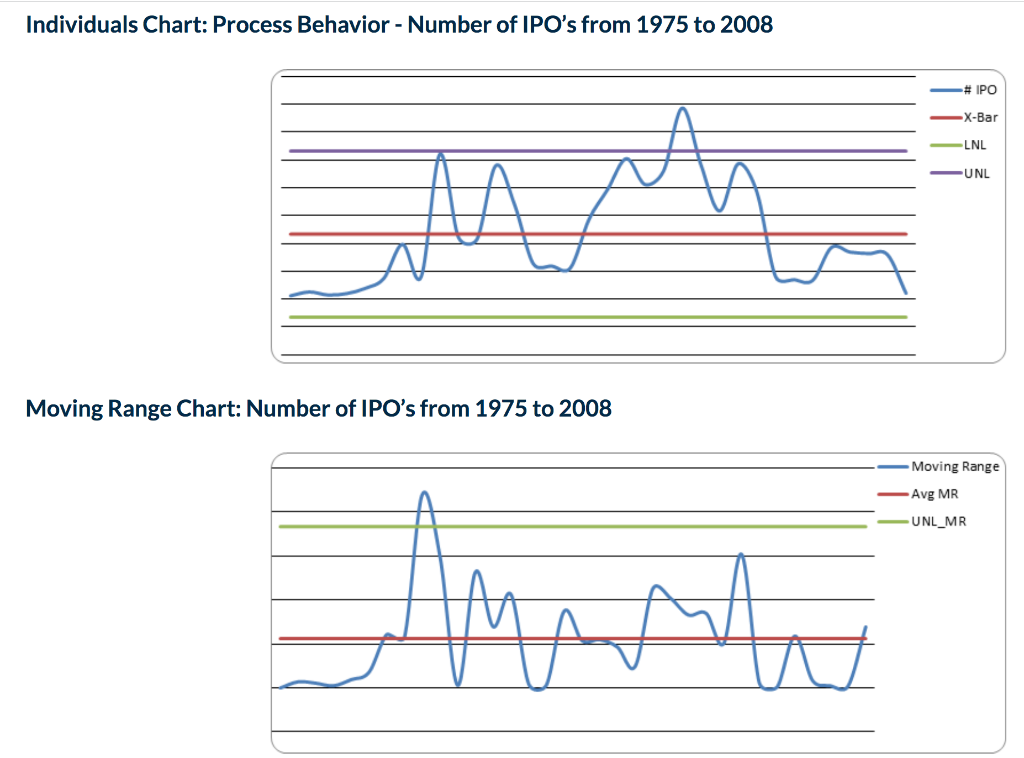
Question: What are some causes to this non-predictable pattern depicted between 1975 through 2008. Individuals Chart: Process Behavior - Number of IPO's from 1975 to 2008
What are some causes to this non-predictable pattern depicted between 1975 through 2008.
Step by Step Solution
There are 3 Steps involved in it
1 Expert Approved Answer
Step: 1 Unlock

Question Has Been Solved by an Expert!
Get step-by-step solutions from verified subject matter experts
Step: 2 Unlock
Step: 3 Unlock