

Question: What are the confidence intervals (lower and upper) for this data? Insert the following into the table: the count and frequency for each group, and
What are the confidence intervals (lower and upper) for this data?

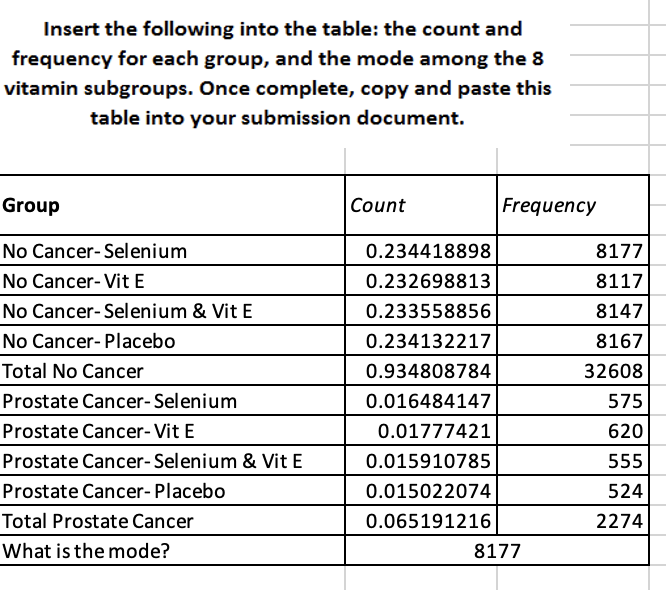
Insert the following into the table: the count and frequency for each group, and the mode among the 8 vitamin subgroups. Once complete, copy and paste this table into your submission document. Group Count Frequency No Cancer- Selenium 0.234418898 8177 No Cancer- Vit E 0.232698813 8117 No Cancer- Selenium & Vit E 0.233558856 8147 No Cancer- Placebo 0.234132217 8167 Total No Cancer 0.934808784 32608 Prostate Cancer- Selenium 0.016484147 575 Prostate Cancer- Vit E 0.01777421 620 Prostate Cancer- Selenium & Vit E 0.015910785 555 Prostate Cancer- Placebo 0.015022074 524 Total Prostate Cancer 0.065191216 2274 What is the mode? 8177
Step by Step Solution
There are 3 Steps involved in it

Get step-by-step solutions from verified subject matter experts