Question: What are the financial problems Playtime will face if it adopts level production? Prepare pro forma financial statements for the first year under the level
What are the financial problems Playtime will face if it adopts level production? Prepare pro forma financial statements for the first year under the level production plan.
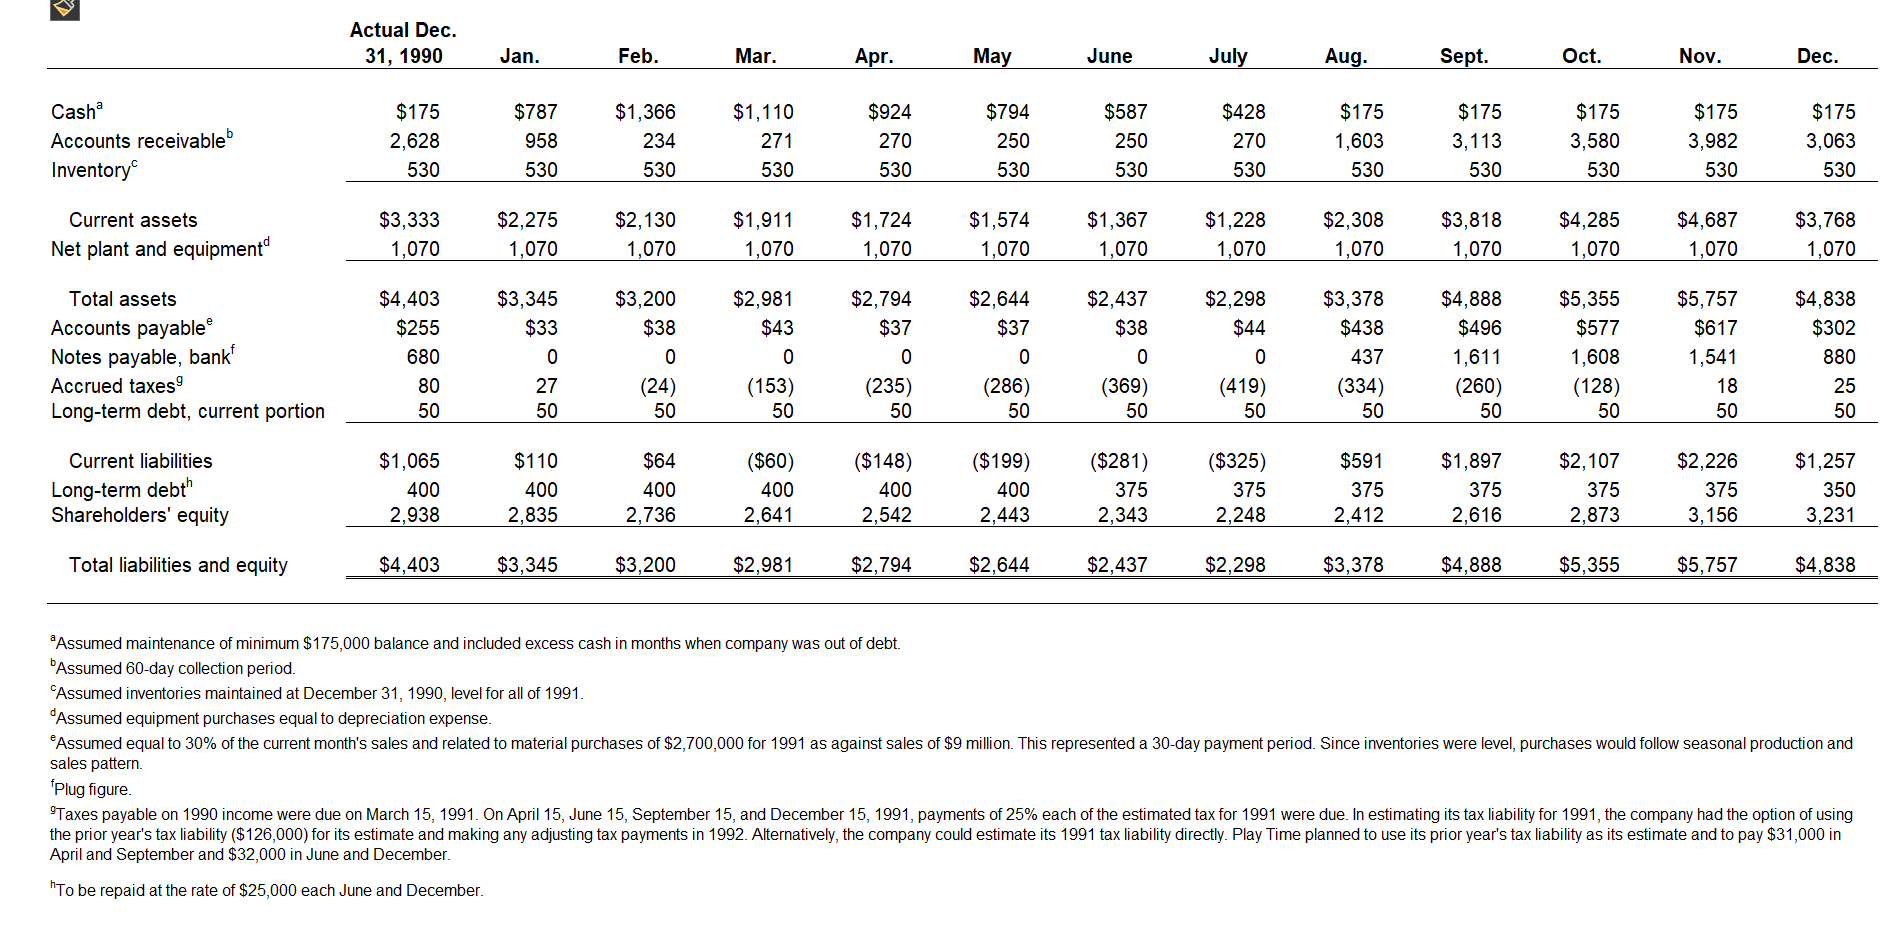
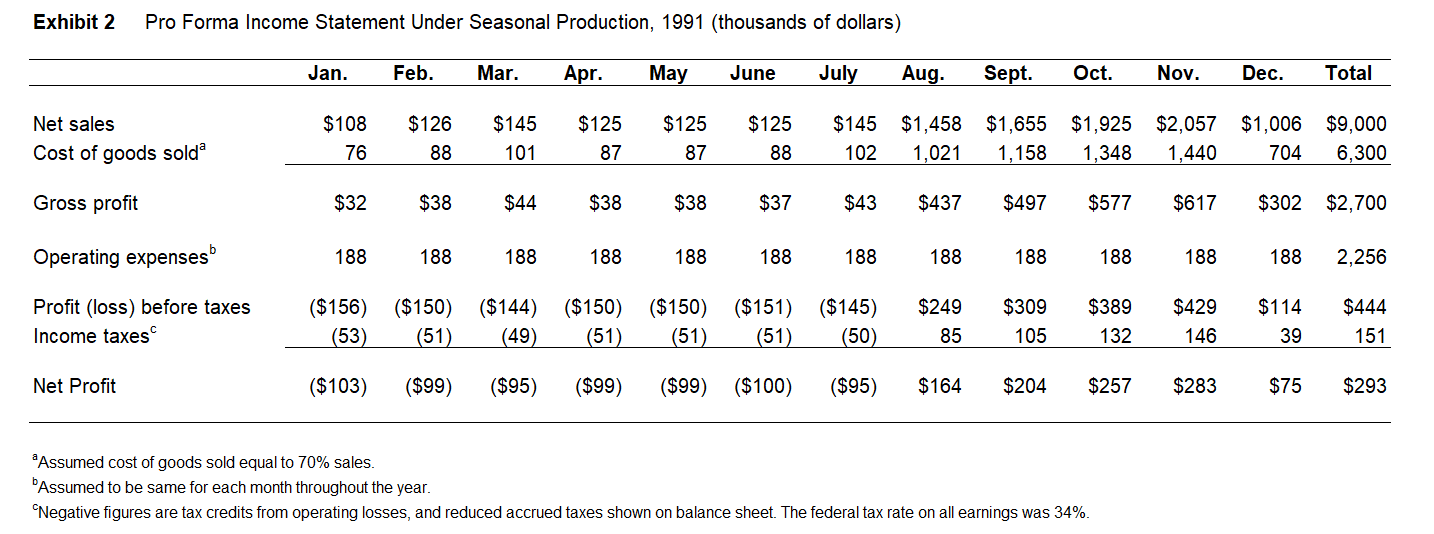
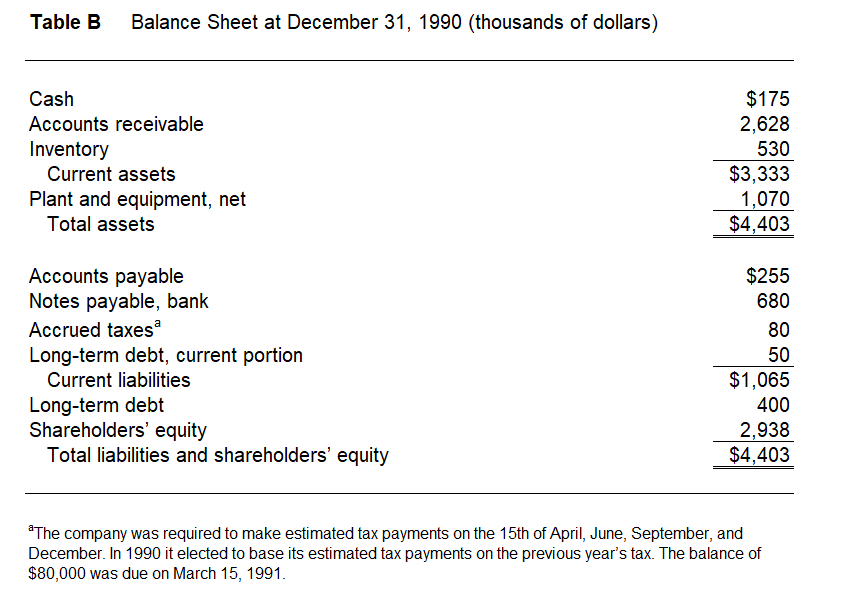
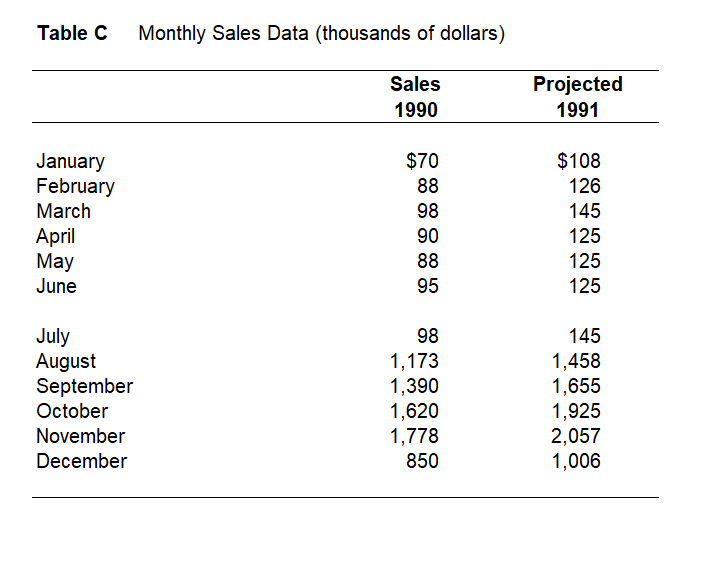
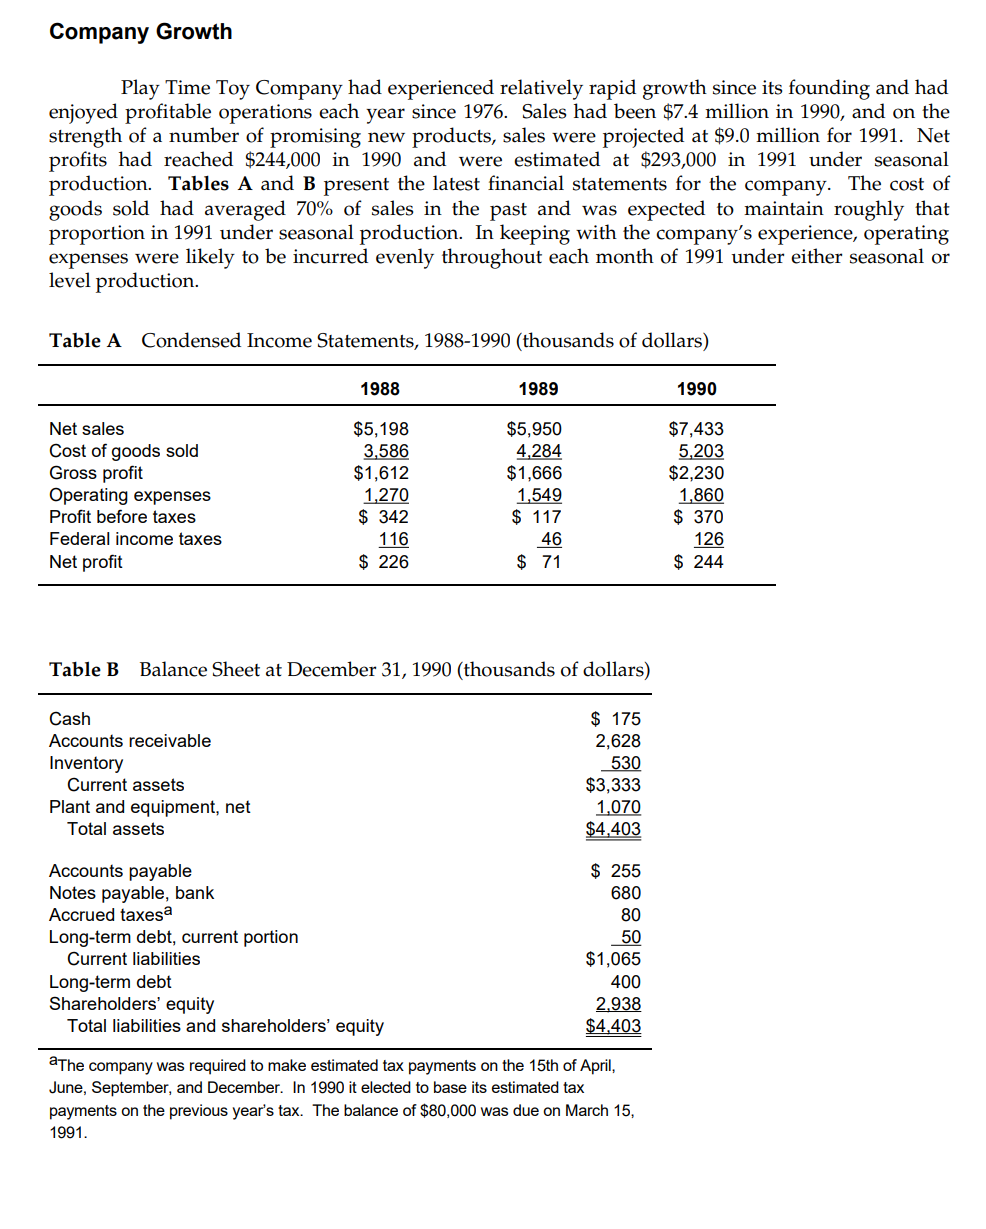
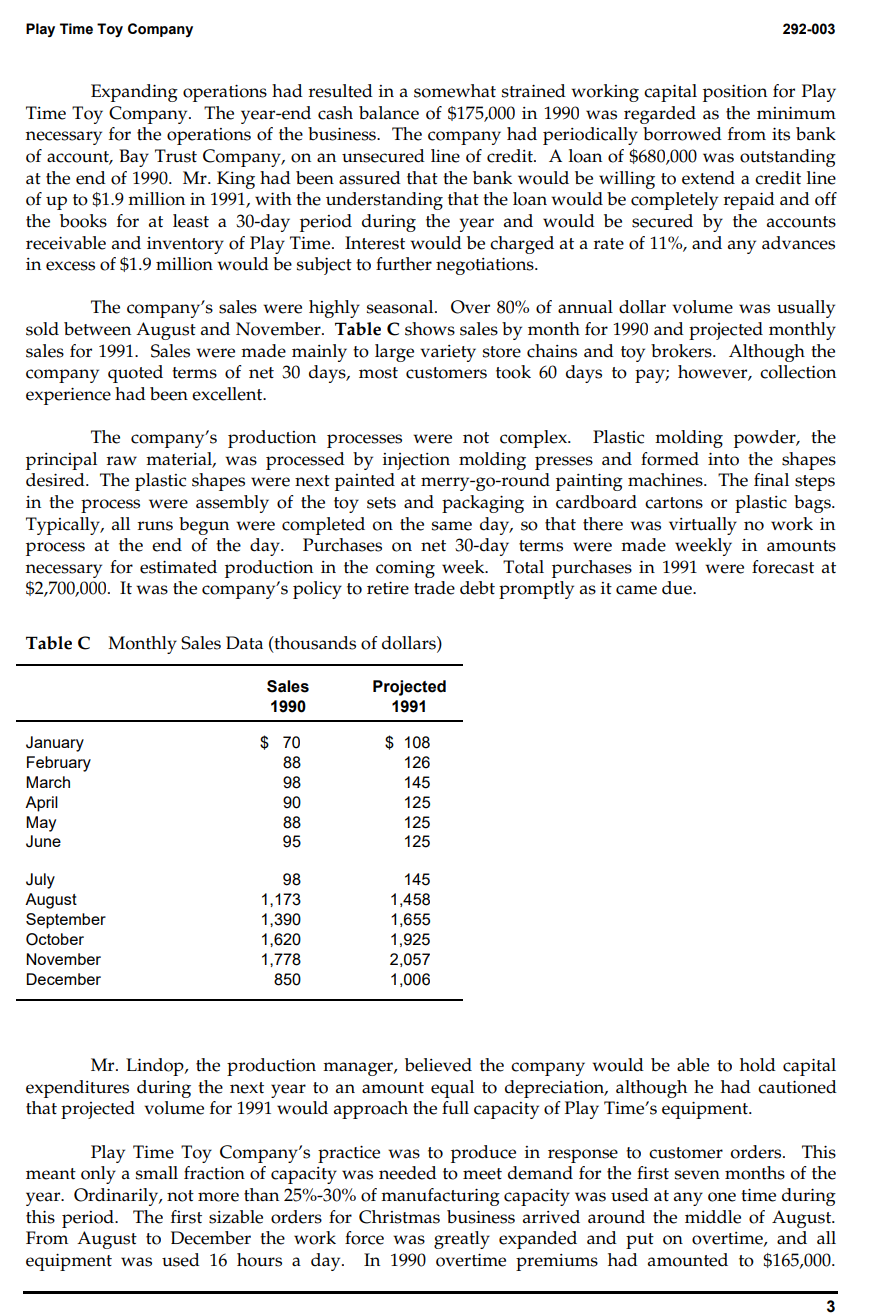
Actual Dec. 31, 1990 Jan. Feb. Mar. Apr. May June July Aug. Sept. Oct. Nov. Dec. Cash $175 $787 $1,366 $1, 1 10 $924 $794 $587 $428 Accounts receivable $175 $175 $175 2,628 $175 958 $175 234 271 270 250 250 Inventory 270 1,603 3, 113 530 3,580 530 530 3,982 3,063 530 530 530 530 530 530 530 530 530 530 Current assets $3,333 $2,275 $2, 130 $1,911 $1,724 $1,574 $1,367 Net plant and equipment" $1,228 $2,308 1,070 $3, 818 $4,285 1,070 1,070 $4,687 1,070 $3,768 1,070 1,070 1,070 1,070 1,070 1,070 1,070 1,070 1,070 Total assets $4,403 $3,345 $3,200 $2,981 $2,794 $2,644 $2,437 Accounts payable $2,298 $3,378 $4, 888 $255 $5,355 $33 $38 $5,757 $4,838 $43 $37 $37 $38 Notes payable, bank $44 $438 $496 $577 680 0 $617 0 $302 0 0 0 0 Accrued taxes 0 437 1,611 80 1,608 27 1,541 (24) 880 (153) (235) Long-term debt, current portion (286) 50 50 (369) (419) 50 (334) 50 (260) (128) 18 50 50 25 50 50 50 50 50 50 50 Current liabilities $1,065 $110 $64 ($60) ($148) ($199) Long-term debt ($281) ($325) $591 $1,897 400 $2, 107 400 $2,226 400 $1,257 400 400 Shareholders' equity 400 375 375 2,938 2,835 375 2,736 375 2,641 2,542 375 375 2,443 350 2,343 2,248 2,412 2,616 2,873 3,156 3,231 Total liabilities and equity $4,403 $3,345 $3,200 $2,981 $2,794 $2,644 $2,437 $2,298 $3,378 $4,888 $5,355 $5,757 $4,838 "Assumed maintenance of minimum $175,000 balance and included excess cash in months when company was out of debt. Assumed 60-day collection period. *Assumed inventories maintained at December 31, 1990, level for all of 1991. "Assumed equipment purchases equal to depreciation expense. sales pattern. "Assumed equal to 30% of the current month's sales and related to material purchases of $2,700,000 for 1991 as against sales of $9 million. This represented a 30-day payment period. Since inventories were level, purchases would follow seasonal production and Plug figure. Taxes payable on 1990 income were due on March 15, 1991. On April 15, June 15, September 15, and December 15, 1991, payments of 25% each of the estimated tax for 1991 were due. In estimating its tax liability for 1991, the company had the option of using the prior year's tax liability ($126,000) for its estimate and making any adjusting tax payments in 1992. Alternatively, the company could estimate its 1991 tax liability directly. Play Time planned to use its prior year's tax liability as its estimate and to pay $31,000 in April and September and $32,000 in June and December "To be repaid at the rate of $25,000 each June and December.Exhibit 2 Pro Forma Income Statement Under Seasonal Production, 1991 (thousands of dollars) Jan. Feb. Mar. Apr. May June July Aug. Sept. Oct. Nov. Dec. Total Net sales $108 $126 $145 $125 $125 $125 $145 $1,458 $1,655 $1,925 $2,057 $1,006 $9,000 Cost of goods solda 76 88 101 87 87 88 102 1,021 1, 158 1,348 1,440 704 6,300 Gross profit $32 $38 $44 $38 $38 $37 $43 $437 $497 $577 $617 $302 $2,700 Operating expenses 188 188 188 188 188 188 188 188 188 188 188 188 2,256 Profit (loss) before taxes ($156) ($150) ($144) ($150) ($150) ($151) ($145) $249 $309 $389 $429 $114 $444 Income taxes (53) (51) (49) (51) (51) (51) (50) 85 105 132 146 39 151 Net Profit ($103) ($99) ($95) ($99) ($99) ($100) ($95) $164 $204 $257 $283 $75 $293 "Assumed cost of goods sold equal to 70% sales. "Assumed to be same for each month throughout the year. "Negative figures are tax credits from operating losses, and reduced accrued taxes shown on balance sheet. The federal tax rate on all earnings was 34%.Table B Balance Sheet at December 31, 1990 (thousands of dollars) Cash Accounts receivable Inventory Current assets Plant and equipment, net Total assets Accounts payable Notes payable, bank Accrued taxes Long-term debt, current portion Current liabilities Long-term debt Shareholders' equity Total liabilities and shareholders' equity $175 2,628 530 $3,333 1,070 $4,403 $255 680 80 50 $1,0865 400 2,938 $4,403 *The company was required to make estimated tax payments on the 15th of April, June, September, and December. In 1990 it elected to base its estimated tax payments on the previous year's tax. The balance of $80,000 was due on March 15, 1991. Table C Monthly Sales Data (thousands of dollars) Sales Projected 1990 1991 January $70 $108 February 88 126 March 98 145 April 90 125 May 88 125 June 95 125 July 98 145 August 1, 173 1,458 September 1,390 1,655 October 1,620 1,925 November 1,778 2,057 December 850 1,006Company Growth Play Time Toy Company had experienced relatively rapid growth since its founding and had enjoyed profitable operations each year since 1976. Sales had been $7.4 million in 1990, and on the strength of a number of promising new products, sales were projected at $9.0 million for 1991. Net prnfits had reached %$244,000 in 1990 and were estimated at $293,000 in 1991 under seasonal production. Tables A and B present the latest financial statements for the company. The cost of goods sold had averaged 70% of sales in the past and was expected to maintain roughly that proportion in 1991 under seasonal production. In keeping with the company's experience, operating expenses were likely to be incurred evenly throughout each month of 1991 under either seasonal or level production. Table A Condensed Income Statements, 1988-1990 (thousands of dollars) 1988 1989 1990 Net sales $5,198 $5,950 $7.,433 Cost of goods sold 3,586 4,284 5,203 Gross profit $1,612 $1,666 $2,230 Operating expenses 1,270 1,549 1,860 Profit before taxes $ 342 $ 117 $ 370 Federal income taxes 116 46 126 Net profit $ 226 $ 7 $ 244 Table B Balance Sheet at December 31, 1990 (thousands of dollars) Cash $ 175 Accounts receivable 2,628 Inventory _530 Current assets $3,333 Plant and equipment, net 1.070 Total assets $4.403 Accounts payable $ 255 Notes payable, bank 680 Accrued taxes? 80 Long-term debt, current portion _a0 Current liabilities $1,065 Long-term debt 400 Shareholders' equity 2.938 Total liabilities and shareholders' equity $4.403 8The company was required to make estimated tax payments on the 15th of April, June, September, and December. In 1990 it elected to base its estimated tax payments on the previous year's tax. The balance of $80,000 was due on March 15, 1991. Play Time Toy Company 292-003 Expanding operations had resulted in a somewhat strained working capital position for Play Time Toy Company. The year-end cash balance of $175,000 in 1990 was regarded as the minimum necessary for the operations of the business. The company had periodically borrowed from its bank of account, Bay Trust Company, on an unsecured line of credit. A loan of $680,000 was outstanding at the end of 1990. Mr. King had been assured that the bank would be willing to extend a credit line of up to $1.9 million in 1991, with the understanding that the loan would be completely repaid and off the books for at least a 30-day period during the year and would be secured by the accounts receivable and inventory of Play Time. Interest would be charged at a rate of 11%, and any advances in excess of $1.9 million would be subject to further negotiations. The company's sales were highly seasonal. Over 80% of annual dollar volume was usually sold between August and November. Table C shows sales by month for 1990 and projected monthly sales for 1991. Sales were made mainly to large variety store chains and toy brokers. Although the company quoted terms of net 30 days, most customers took 60 days to pay; however, collection experience had been excellent. The company's production processes were not complex. Plastic molding powder, the principal raw material, was processed by injection molding presses and formed into the shapes desired. The plastic shapes were next painted at merry-go-round painting machines. The final steps in the process were assembly of the toy sets and packaging in cardboard cartons or plastic bags. Typically, all runs begun were completed on the same day, so that there was virtually no work in process at the end of the day. Purchases on net 30-day terms were made weekly in amounts necessary for estimated production in the coming week. Total purchases in 1991 were forecast at $2,700,000. It was the company's policy to retire trade debt promptly as it came due. Table C Monthly Sales Data (thousands of dollars) Sales Projected 1990 1991 January $ 70 $ 108 February 88 126 March 98 145 April 90 125 May 88 125 June 95 125 July a8 145 August 1,173 1,458 September 1,390 1,655 October 1,620 1,925 November 1,778 2,057 December 850 1,006 Mr. Lindop, the production manager, believed the company would be able to hold capital expenditures during the next year to an amount equal to depreciation, although he had cautioned that projected volume for 1991 would approach the full capacity of Play Time's equipment. Play Time Toy Company's practice was to produce in response to customer orders. This meant only a small fraction of capacity was needed to meet demand for the first seven months of the year. Ordinarily, not more than 25%-30% of manufacturing capacity was used at any one time during this period. The first sizable orders for Christmas business arrived around the middle of August. From August to December the work force was greatly expanded and put on overtime, and all equipment was used 16 hours a day. In 1990 overtime premiums had amounted to $165,000. 3 292-003 Play Time Toy Company Shipments were made whenever possible on the day an order was produced. Hence, production and sales amounts in each month tended to be equal. As in the past, pro forma balance sheets and income statements based on an assumption of seasonal production had been prepared for 1991 and presented to Mr. King for his examination. These appear in Exhibits 1 and 2. The Proposed Change to Level Production Having experienced one selling season at Play Time, Mr. Lindop was deeply impressed by the many problems that arose from the company's method of scheduling production. Overtime premiums reduced profits; seasonal expansion and contraction of the work force resulted in recruiting difficulties and high training and quality control costs. Machinery stood idle for seven- and-a-half months and then was subjected to heavy use. Accelerated production schedules during the peak season resulted in frequent setup changes on the machinery. Seemingly unavoidable confusion in scheduling runs resulted. Short runs and frequent setup changes caused inefficiencies in assembly and packaging as workers encountered difficulty relearning their operations. For these reasons, Mr. Lindop had urged Mr. King to adopt a policy of level monthly production in 1991. He pointed out that estimates of sales volume had usually proved to be reliable in the past. Purchase terms would not be affected by the rescheduling of purchases. The elimination of overtime wage premiums would result in substantial savings, estimated at $200,000 in 1991. Moreover, Mr. Lindop firmly believed that significant additional direct labor savings, amounting to about $235,000, would result from orderly production. But a portion of the savings would be offset by higher storage and handling costs, estimated at $100,000 annually. Mr. King speculated on the effect that level production might have on the company's funds requirements in 1991. He assumed that except for profits and fluctuations in the levels of inventories, accounts receivable, and accounts payable, funds inflows and outflows would be approximately in balance. To simplify the problem, Mr. King decided to assume that gross margin percentages would not vary significantly by month under either method of production. That is, cost of goods sold would be 70% of sales in each of the 12 months under seasonal production and would be 65.16% of sales in each of the 12 months under level production. The increased storage and handling costs of $100,000 would be included in operating expenses
Step by Step Solution
There are 3 Steps involved in it
1 Expert Approved Answer
Step: 1 Unlock
Question Has Been Solved by an Expert!
Get step-by-step solutions from verified subject matter experts
Step: 2 Unlock
Step: 3 Unlock
Students Have Also Explored These Related Finance Questions!