

Question: What are the key differences in this Component Percentage Balance Sheet ? B c D E G HI Wal-Mart Annual Report Component Percentages 31-Jan-20 31-Jan-1
What are the key differences in this Component Percentage Balance Sheet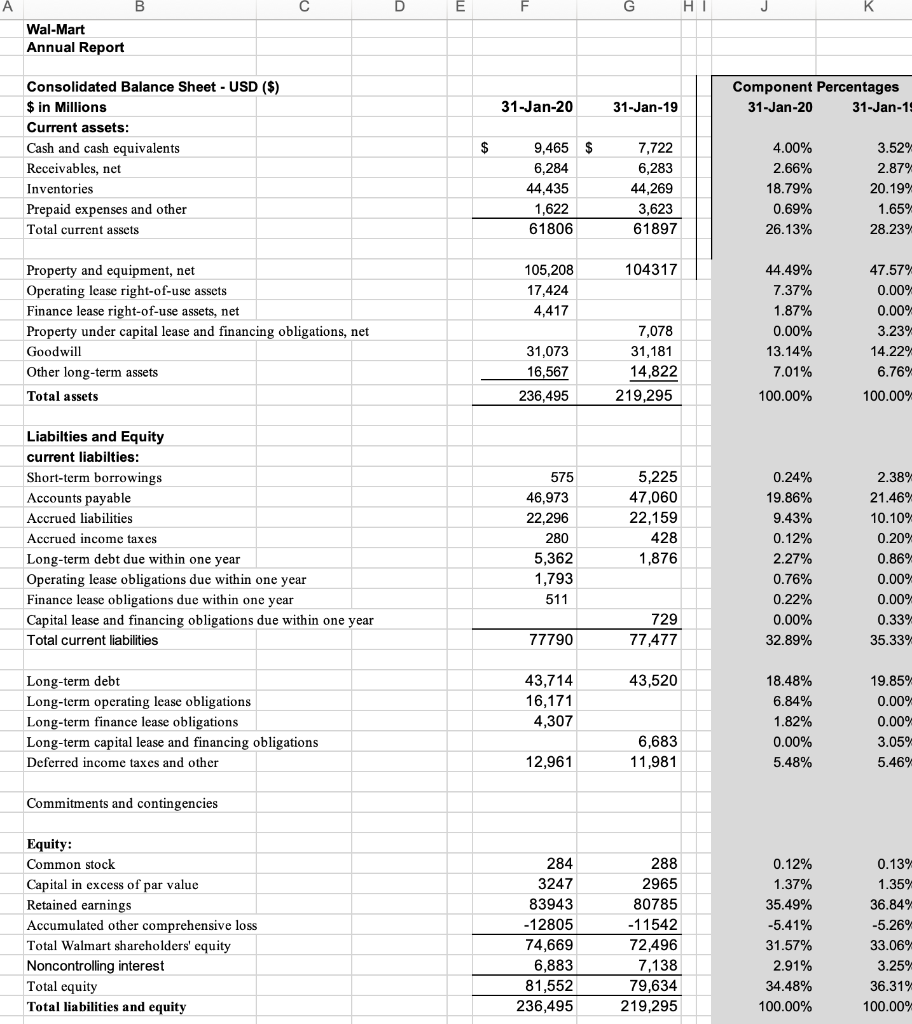 ?
?
B c D E G HI Wal-Mart Annual Report Component Percentages 31-Jan-20 31-Jan-1 31-Jan-20 31-Jan-19 $ Consolidated Balance Sheet - USD ($) $ in Millions Current assets: Cash and cash equivalents Receivables, net Inventories Prepaid expenses and other Total current assets 9,465 $ 6,284 44,435 1,622 61806 7,722 6,283 44,269 3,623 61897 4.00% 2.66% 18.79% 0.69% 26.13% 3.52% 2.87% 20.19% 1.65% 28.23% 104317 105,208 17.424 4,417 Property and equipment, net Operating lease right-of-use assets Finance lease right-of-use assets, net Property under capital lease and financing obligations, net Goodwill Other long-term assets Total assets 44.49% 7.37% 1.87% 0.00% 13.14% 7.01% 100.00% 47.57% 0.00% 0.00% 3.23% 14.22% 6.76% 7,078 31,181 14,822 219,295 31,073 16,567 236,495 100.00% Liabilties and Equity current liabilties: Short-term borrowings Accounts payable Accrued liabilities Accrued income taxes Long-term debt due within one year Operating lease obligations due within one year Finance lease obligations due within one year Capital lease and financing obligations due within one year Total current liabilities 575 46,973 22,296 280 5,362 1,793 511 5,225 47,060 22,159 428 1,876 0.24% 19.86% 9.43% 0.12% 2.27% 0.76% 0.22% 0.00% 32.89% 2.38% 21.46% 10.10% 0.20% 0.86% 0.00% 0.00% 0.33% 35.33% 729 77,477 77790 43,520 Long-term debt Long-term operating lease obligations Long-term finance lease obligations Long-term capital lease and financing obligations Deferred income taxes and other 43,714 16,171 4,307 18.48% 6.84% 1.82% 0.00% 5.48% 19.85% 0.00% 0.00% 3.05% 5.46% 6,683 11,981 12,961 Commitments and contingencies Equity: Common stock Capital in excess of par value Retained earnings Accumulated other comprehensive loss Total Walmart shareholders' equity Noncontrolling interest Total equity Total liabilities and equity 284 3247 83943 -12805 74,669 6,883 81,552 236,495 288 2965 80785 -1 1542 72,496 7,138 79,634 219,295 0.12% 1.37% 35.49% -5.41% 31.57% 2.91% 34.48% 100.00% 0.13% 1.35% 36.84% -5.26% 33.06% 3.25% 36.31% 100.00% B c D E G HI Wal-Mart Annual Report Component Percentages 31-Jan-20 31-Jan-1 31-Jan-20 31-Jan-19 $ Consolidated Balance Sheet - USD ($) $ in Millions Current assets: Cash and cash equivalents Receivables, net Inventories Prepaid expenses and other Total current assets 9,465 $ 6,284 44,435 1,622 61806 7,722 6,283 44,269 3,623 61897 4.00% 2.66% 18.79% 0.69% 26.13% 3.52% 2.87% 20.19% 1.65% 28.23% 104317 105,208 17.424 4,417 Property and equipment, net Operating lease right-of-use assets Finance lease right-of-use assets, net Property under capital lease and financing obligations, net Goodwill Other long-term assets Total assets 44.49% 7.37% 1.87% 0.00% 13.14% 7.01% 100.00% 47.57% 0.00% 0.00% 3.23% 14.22% 6.76% 7,078 31,181 14,822 219,295 31,073 16,567 236,495 100.00% Liabilties and Equity current liabilties: Short-term borrowings Accounts payable Accrued liabilities Accrued income taxes Long-term debt due within one year Operating lease obligations due within one year Finance lease obligations due within one year Capital lease and financing obligations due within one year Total current liabilities 575 46,973 22,296 280 5,362 1,793 511 5,225 47,060 22,159 428 1,876 0.24% 19.86% 9.43% 0.12% 2.27% 0.76% 0.22% 0.00% 32.89% 2.38% 21.46% 10.10% 0.20% 0.86% 0.00% 0.00% 0.33% 35.33% 729 77,477 77790 43,520 Long-term debt Long-term operating lease obligations Long-term finance lease obligations Long-term capital lease and financing obligations Deferred income taxes and other 43,714 16,171 4,307 18.48% 6.84% 1.82% 0.00% 5.48% 19.85% 0.00% 0.00% 3.05% 5.46% 6,683 11,981 12,961 Commitments and contingencies Equity: Common stock Capital in excess of par value Retained earnings Accumulated other comprehensive loss Total Walmart shareholders' equity Noncontrolling interest Total equity Total liabilities and equity 284 3247 83943 -12805 74,669 6,883 81,552 236,495 288 2965 80785 -1 1542 72,496 7,138 79,634 219,295 0.12% 1.37% 35.49% -5.41% 31.57% 2.91% 34.48% 100.00% 0.13% 1.35% 36.84% -5.26% 33.06% 3.25% 36.31% 100.00%
Step by Step Solution
There are 3 Steps involved in it

Get step-by-step solutions from verified subject matter experts