Question: What are the key elements to keep in mind to identify the free cash flows (FCFs) for investment analysis? Free Cash Flow = Capital costs
What are the key elements to keep in mind to identify the free cash flows (FCFs) for investment analysis?
Free Cash Flow = Capital costs + Working Capital Investment + Operating profit after taxes + add back depreciation
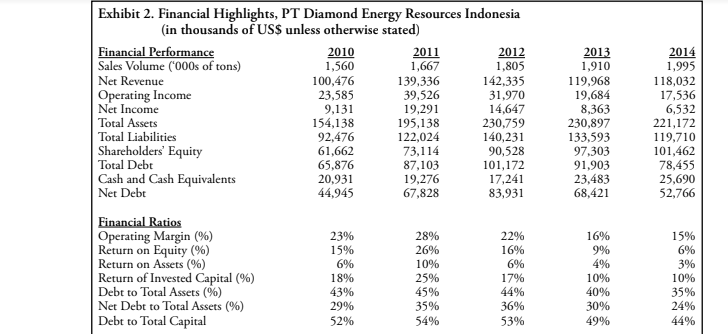
Calculate the Weighted Average Cost of Capital (WACC) for the Diamond Energy Resources. (WACC = Cost of Equity * Proportion of Equity + Cost of Debt * Proportion of Debt)
How does the capital structure of a project affect the WACC?
How do you determine if an investment creates value? (Find the NPV, IRR, Payback period, (discounted payback period, if necessary), and profitability index
What factors need to be considered?
How do you improve the quality of decision-making in a world of uncertainty?
List all benefits and risks. After considering all the risks and benefits of the investment, do you think Diamond Energy resources should invest in this project?
Steps for FCF calculation:
Revenue
- costs (production and SGA)
-Depreciation expense
= Operating profit before tax (EBIT)
-Tax
= operating profit after tax
+ depreciation expense
= Operating cash Flows (OCF)
+ / - changes in capital expenditure
+ / - changes in net working capital
= Free Cash Flows (FCF)
Exhibit 2. Financial Highlights, PT Diamond Energy Resources Indonesia (in thousands of US$ unless otherwise stated) Financial Performance 2010 2011 2012 2013 2014 Sales Volume ('000s of tons) 1,560 1,667 1,805 1,910 1,995 Net Revenue 100,476 139,336 142,335 119,968 118,032 Operating Income 23,585 39,526 31,970 19,684 17,536 Net Income 9,131 19,291 14,647 8,363 6,532 Total Assets 154,138 195,138 230,759 230,897 221,172 Total Liabilities 92,476 122,024 140,231 133.593 119,710 Shareholders' Equity 61,662 73,114 90,528 97.303 101,462 Total Debt 65,876 87,103 101,172 91,903 78,455 Cash and Cash Equivalents 20,931 19,276 17,241 23,483 25,690 Net Debt 44,945 67,828 83,931 68,421 52,766 Financial Ratios Operating Margin (%) 23% 28% 22% 16% 15% Return on Equity (%) 15% 26% 16% 9% 6% Return on Assets (%) 6% 10% 6% 4% 3% Return of Invested Capital (%) 18% 25% 17% 10% 10% Debt to Total Assets (9%) 43% 45% 44% 40% 35% Net Debt to Total Assets (%) 29% 35% 36% 30% 24% Debt to Total Capital 52% 54% 53% 49% 44%Exhibit 3. Financial Highlights of Selected InOpen with I Mining Companies, 2014 Operating Operating Revenue Income Income Debt to Total Company (US$m) (US$m) Margin Capital PT Diamond Energy Resources Indonesia 118 18 15% 44% PT Adaro Energy 3,325 388.0 12% 49% PT Atlas Resources 35 (34.6) -99% 53% Pt Berau Coal Energy 1,633 182.6 1 1% 104% PT Bumi Resources 2,786 (1,686.6) -61% 148% PT Darma Henwa 269 10.9 4% 19% PT Delta Dunia Makmur 659 93.7 14% 88% PT Indo Tambangraya Megah 1,930 187.6 10% 0% PT Petrosea 288 20.8 7% 48% PT Tambang Batubara Bukit Asam 1,160 188.0 16% 18.9% Note: Companies with debt to total capital greater than 100% had negative equity in 2014. Source: FT.com. Exhibit 4. Indonesia's Coal Production and Export from 2007-2014. 2007 2008 2009 2010 2011 2012 2013 2014 Production 217 240 254 275 353 412 474 458 Export 163 191 198 210 287 345 402 382 Domestic 61 49 56 65 66 67 72 76 in million tons Source: http://www.indonesia-investments.com/doing-business/commodities/coal/item236. Exhibit 5: Indonesia Central Bank's Benchmark Interest Rates 14 12 10 2006 2008 2010 2012 2014 Source: Trading Economics (http://www.tradingeconomics.com/indonesia/interest-rate)
Step by Step Solution
There are 3 Steps involved in it
1 Expert Approved Answer
Step: 1 Unlock
Question Has Been Solved by an Expert!
Get step-by-step solutions from verified subject matter experts
Step: 2 Unlock
Step: 3 Unlock
Students Have Also Explored These Related Accounting Questions!