

Question: what are the points to graph Requirement 4. Draw a graph illustrating your total cost under this plan. Show the costs at 700, 900, and
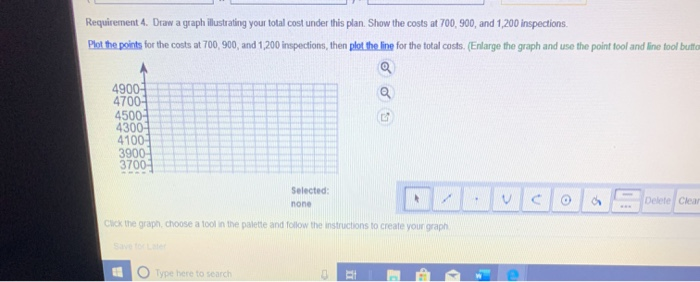
Requirement 4. Draw a graph illustrating your total cost under this plan. Show the costs at 700, 900, and 1,200 inspections. Plot the points for the costs at 700, 900, and 1,200 inspections, then plot the line for the total costs. (Enlarge the graph and use the point tool and line tool buto 4900- 4700- 4500- 4300 4100 3900 37004 Selected: Delete Clear none Click the graph, choose a tool in the palette and follow the instructions to create your graph Save for Later Type here to search Requirement 4. Draw a graph illustrating your total cost under this plan. Show the costs at 700, 900, and 1,200 inspections. Plot the points for the costs at 700, 900, and 1,200 inspections, then plot the line for the total costs. (Enlarge the graph and use the point tool and line tool buto 4900- 4700- 4500- 4300 4100 3900 37004 Selected: Delete Clear none Click the graph, choose a tool in the palette and follow the instructions to create your graph Save for Later Type here to search
Step by Step Solution
There are 3 Steps involved in it

Get step-by-step solutions from verified subject matter experts