Question: what are two things about this pie chart that you would improve to make it more effective at presenting information? Percent of Enterprise Statistical Analysis

what are two things about this pie chart that you would improve to make it more effective at presenting information?what are two things about this pie chart that you

Percent of Enterprise Statistical Analysis Analytical Reporting Power User OLAP 4.25% Producer IT Consumer 0,04% Producer 1.9616 0.75% Consumer 3.5096 Producer Application Development Data Mining Meta Data Design Business User 21.50% consumer Consumer 37 2440 Scorecards Performance Management Business Reporting Packaged Apps Extended Enterprise User 1.5035 Producer Extranets/B2B B2C Mobile/Wireless Casual User 28.50 Consumer Producer 0.76% Dashboards Enterprise Reporting Source: Giga Research,d wholly owned subsidiary of Forester Research, le

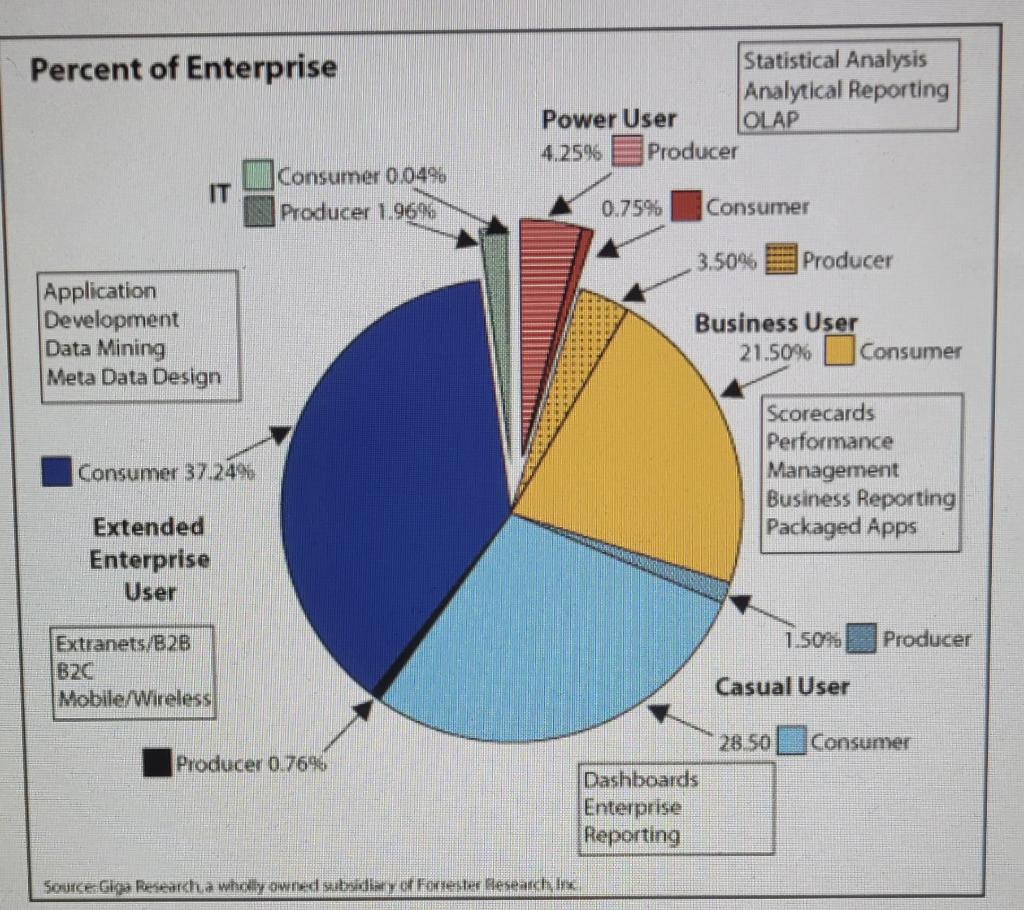
Step by Step Solution

There are 3 Steps involved in it

1 Expert Approved Answer
Step: 1 Unlock blur-text-image
Question Has Been Solved by an Expert!

Get step-by-step solutions from verified subject matter experts

Step: 2 Unlock
Step: 3 Unlock

Students Have Also Explored These Related General Management Questions!