

Question: What can i interpret from this TGA graph? Can i have a full summary of it thanks 120 2.0 Decomposition Temperature 100 472.58C 1.5 80
What can i interpret from this TGA graph? Can i have a full summary of it thanks
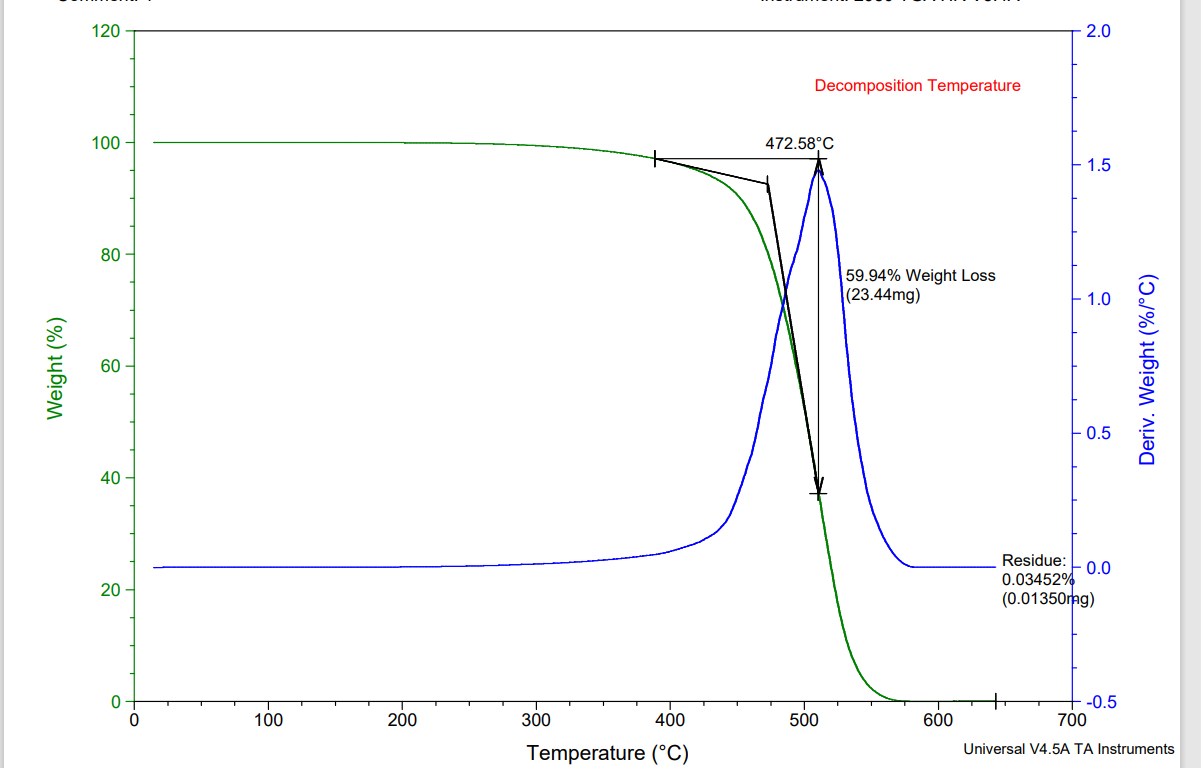
120 2.0 Decomposition Temperature 100 472.58C 1.5 80 59.94% Weight Loss (23.44mg) 1.0 Weight (%) Deriv. Weight (%/C) 0.5 40 20 Residue: 0.0 0.03452% (0.01350 g) 0 07 100 -0.5 700 200 300 400 500 600 Temperature (C) Universal V4.5A TA Instruments
Step by Step Solution
There are 3 Steps involved in it
1 Expert Approved Answer
Step: 1 Unlock

Question Has Been Solved by an Expert!
Get step-by-step solutions from verified subject matter experts
Step: 2 Unlock
Step: 3 Unlock