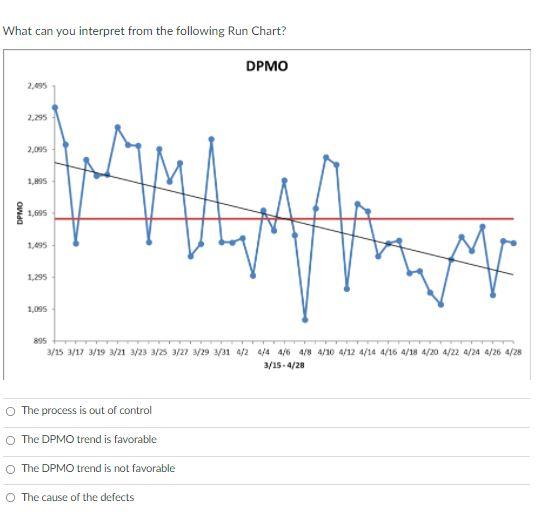
Question: What can you interpret from the following Run Chart? DPMO 2,095 2.295 2.05 #78 1.695 1.695 1.295 1.095 895 3/15/173/19 3/21 123 3/5 3/27/29 31

What can you interpret from the following Run

What can you interpret from the following Run Chart? DPMO 2,095 2.295 2.05 #78 1.695 1.695 1.295 1.095 895 3/15/173/19 3/21 123 3/5 3/27/29 31 4/2 4/4 4/6 4/8/10 4/12 4/14 4/16 4/18 4/20 4/224/24 6/26 4/28 3/15-4/28 The process is out of control The DPMO trend is favorable The DPMO trend is not favorable The cause of the defects

Step by Step Solution

There are 3 Steps involved in it

1 Expert Approved Answer
Step: 1 Unlock blur-text-image
Question Has Been Solved by an Expert!

Get step-by-step solutions from verified subject matter experts

Step: 2 Unlock
Step: 3 Unlock

Students Have Also Explored These Related General Management Questions!