

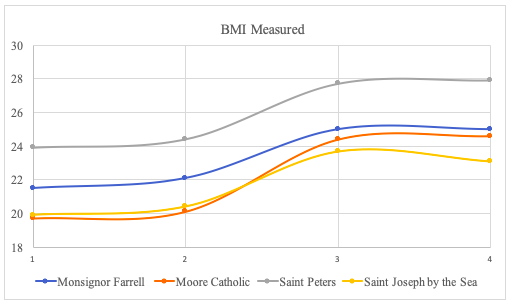
Question: what can you say about this graph ? it is looking at: Does participation in youth sport played by male athletes predict development of obesity?
what can you say about this graph ?
it is looking at: Does participation in youth sport played by male athletes predict development of obesity?
the bottoms are schools and BMI measured are means of 100s of students
what can the plateau part mean?
would this graph have a significant p value for saying sports decrease the risk of obesity?
\f
Step by Step Solution
There are 3 Steps involved in it
1 Expert Approved Answer
Step: 1 Unlock

Question Has Been Solved by an Expert!
Get step-by-step solutions from verified subject matter experts
Step: 2 Unlock
Step: 3 Unlock