

Question: What can't you read- I need help with the formulas for the following questions. I wanted to make sure I used the correct formula and
What can't you read- I need help with the formulas for the following questions. I wanted to make sure I used the correct formula and got correct answer in column H to make sure I am calculating the answer in 16-18 correct. You wasn't clear on what you couldn't read.
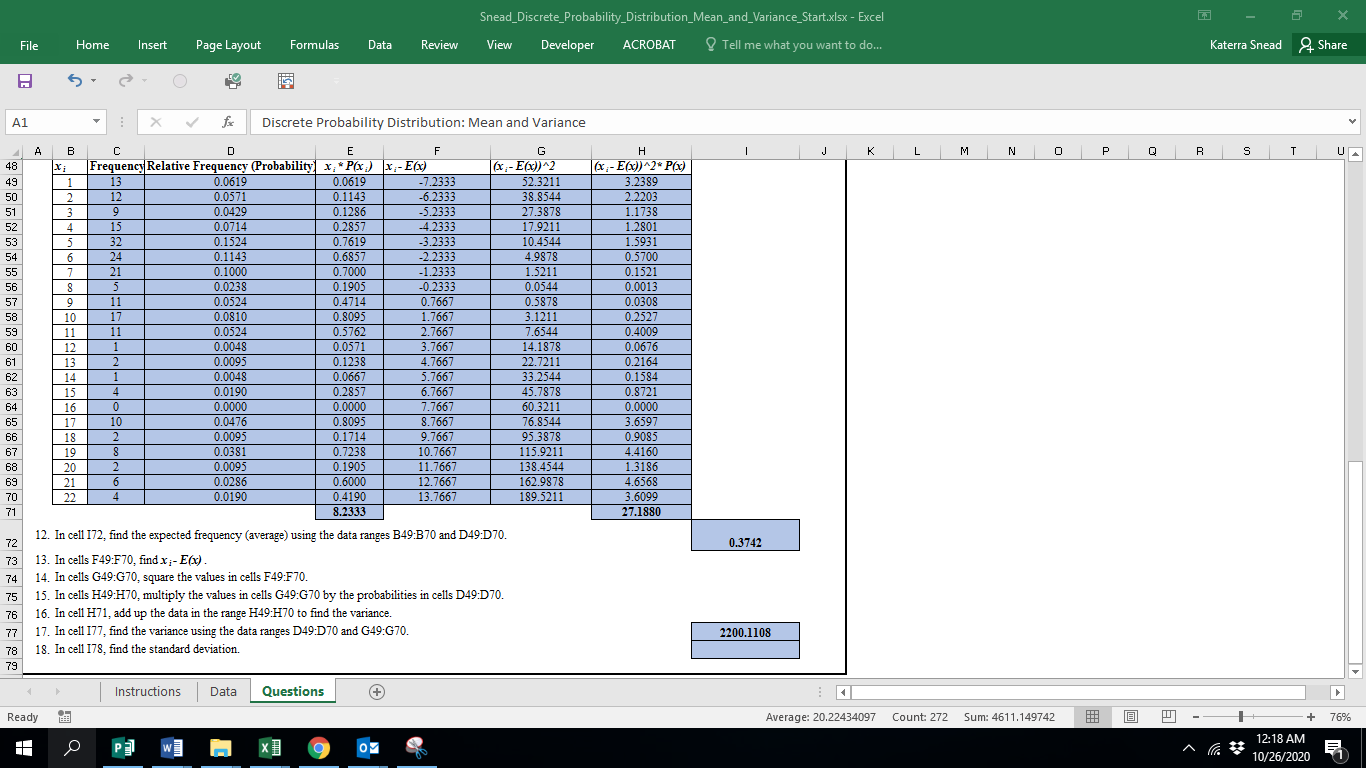
| In cells H49:H70, multiply the values in cells G49:G70 by the probabilities in cells D49:D70. |
| In cell H71, add up the data in the range H49:H70 to find the variance. | |||||||
| In cell I77, find the variance using the data ranges D49:D70 and G49:G70. | 2200.1108 | ||||||
| In cell I78, find the standard deviation. | |||||||
I asked a question the other night. I need help solving for variance and standard deviation. They calculated it but didn't help with the formula in excel. I was told to calculate it using data in column H. I am trying to solve #16, 17, and 18, but want to make sure my data is correct in other cells. I don't know if you can help review my work.
Snead_Discrete_Probability_Distribution_Mean_and_Variance_Start.xlsx - Excel View Developer ACROBAT Tell me what you want to do... File Home Insert Page Layout Formulas Data Review Katerra Snead Share A1 for Discrete Probability Distribution: Mean and Variance A 1 J KL M N P Q R 5 T U 48 49 50 51 52 53 54 55 56 57 58 59 60 61 62 63 64 65 66 67 68 69 B X; 1 1 2 3 4 5 6 7 8 9 10 11 12 13 14 15 16 17 18 19 20 | 21 | 22 D E F Frequency Relative Frequency (Probability) x *P(x :) x-E(x) 13 0.0619 0.0619 -7.2333 12 0.0571 0.1143 -6.2333 9 0.0429 0.1286 -5.2333 15 0.0714 0.2857 -4.2333 32 0.1524 0.7619 -3.2333 24 0.1143 0.6857 -2.2333 21 0.1000 0.7000 -1.2333 0.0238 0.1905 -0.2333 11 0.0524 0.4714 0.7667 17 0.0810 0.8095 1.7667 11 0.0524 0.5762 2.7667 1 0.0048 0.0571 3.7667 2 0.0095 0.1238 4.7667 1 1 0.0048 0.0667 5.7667 4 0.0190 0.2857 6.7667 0 0.0000 0.0000 7.7667 10 0.0476 0.8095 8.7667 2 0.0095 0.1714 9.7667 8 0.0381 0.7238 10.7667 2 0.0095 0.1905 11.7667 6 0.0286 0.6000 12.7667 4 4 0.0190 0.4190 13.7667 8.2333 G (x - E(x))^2 52.3211 38.8544 27.3878 17.9211 10.4544 4.9878 1.5211 0.0544 0.5878 3.1211 7.6544 14.1878 22.7211 33.2544 45.7878 60.3211 76.8544 95.3878 115.9211 138.4544 162.9878 189.5211 . (x - E(x))^2 P(x) 3.2389 2.2203 1.1738 1.2801 1.5931 0.5700 0.1521 0.0013 0.0308 0.2527 0.4009 0.0676 0.2164 0.1584 0.8721 0.0000 3.6597 0.9085 4.4160 1.3186 4.6568 3.6099 27.1880 70 71 0.3742 72 73 74 75 76 12. In cell 172, find the expected frequency (average) using the data ranges B49:870 and D49:D70. 13. In cells F49:F70, find X;-E(x) 14. In cells G49:G70, square the values in cells F49:F70. 15. In cells H49:H70, multiply the values in cells G49:G70 by the probabilities in cells D49:D70. 16. In cell H71, add up the data in the range H49:H70 to find the variance. 17. In cell 177, find the variance using the data ranges D49:070 and G49:G70. 18. In cell 178, find the standard deviation. 77 2200.1108 78 79 | Instructions Data Questions Ready Average: 20.22434097 Count: 272 Sum: 4611.149742 @ + 76% 1 P W OM I * 12:18 AM 10/26/2020
Step by Step Solution
There are 3 Steps involved in it

Get step-by-step solutions from verified subject matter experts