

Question: What chart type is useful for showing trends in data over time, such as days, months, or years? Pie Bar Column Line After inserting a
What chart type is useful for showing trends in data over time, such as days, months, or years?
Pie
Bar
Column
Line
After inserting a picture or shape on a worksheet, which aspects of the images appearance can you edit?
Its size and style
Its size and color
Its style and color
Its size, style, and color
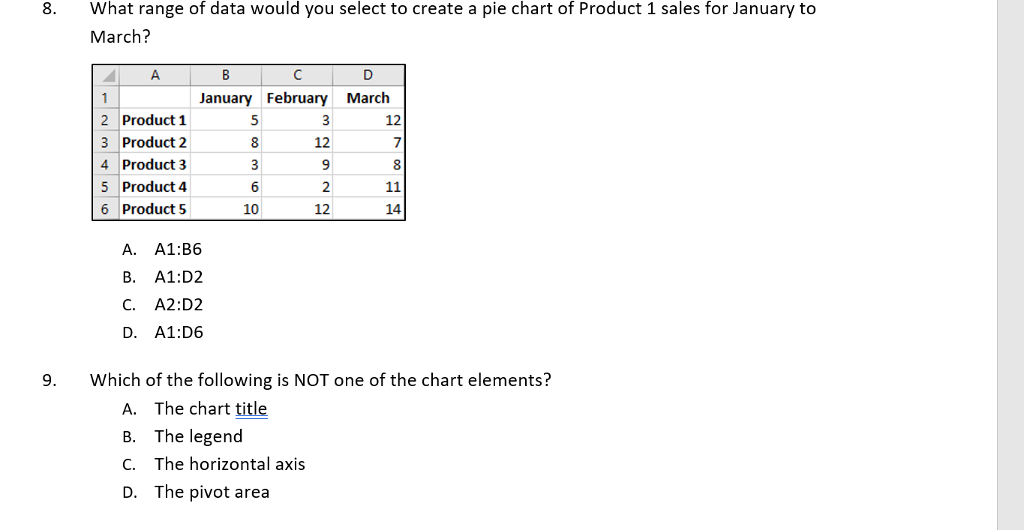
What range of data would you select to create a pie chart of Product 1 sales for January to March? 8. January February March 2 Product 1 3 Product 2 4 Product 3 5 Product 4 6 Product 5 12 12 2 10 12 14 A. A1:B6 B. A1:D2 C. A2:D2 D. A1:D6 9. Which of the following is NOT one of the chart elements? A. The chart title B. The legend C. The horizontal axis D. The pivot area
Step by Step Solution
There are 3 Steps involved in it

Get step-by-step solutions from verified subject matter experts