

Question: what * Dent ADA ADA JOH Acce Data . Acce CDC Child * Regis FSME $ U.S. DE The L Th yopenmath.com/assess2/?cid=114438&aid=8207234#/skip/9 Major League Baseball
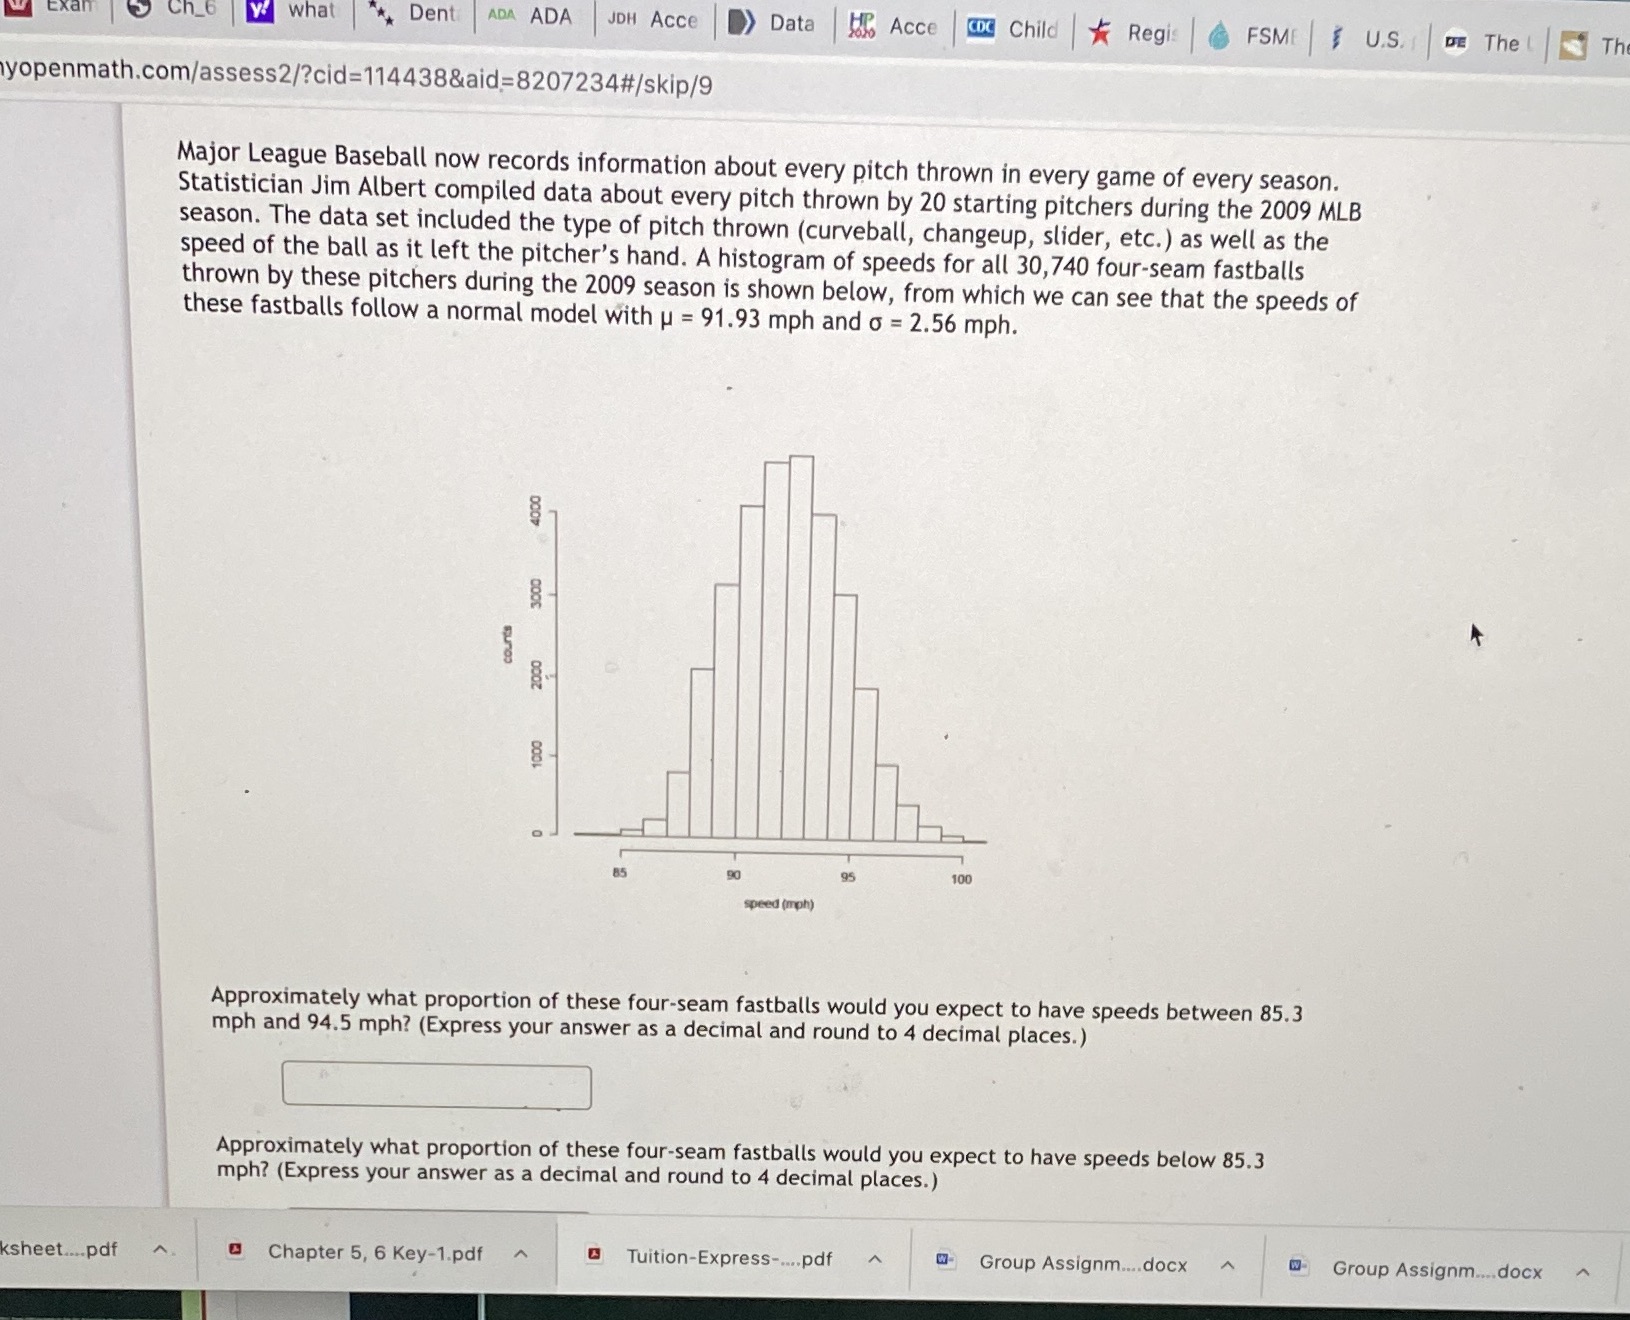
what * Dent ADA ADA JOH Acce Data . Acce CDC Child * Regis FSME $ U.S. DE The L Th yopenmath.com/assess2/?cid=114438&aid=8207234#/skip/9 Major League Baseball now records information about every pitch thrown in every game of every season. Statistician Jim Albert compiled data about every pitch thrown by 20 starting pitchers during the 2009 MLB season. The data set included the type of pitch thrown (curveball, changeup, slider, etc. ) as well as the speed of the ball as it left the pitcher's hand. A histogram of speeds for all 30,740 four-seam fastballs thrown by these pitchers during the 2009 season is shown below, from which we can see that the speeds of these fastballs follow a normal model with u = 91.93 mph and o = 2.56 mph. 40DO 3000 courts 2000 1000 speed (mph) Approximately what proportion of these four-seam fastballs would you expect to have speeds between 85.3 mph and 94.5 mph? (Express your answer as a decimal and round to 4 decimal places.) Approximately what proportion of these four-seam fastballs would you expect to have speeds below 85.3 mph? (Express your answer as a decimal and round to 4 decimal places.) ksheet....pdf Chapter 5, 6 Key-1.pdf Tuition-Express-...pdf Group Assignm....docx Group Assignm....docx
Step by Step Solution
There are 3 Steps involved in it

Get step-by-step solutions from verified subject matter experts