

Question: What do I need to do here? glaph MILO C it represents the tem scales. of the fand (1.2.27) The following table shows the world
What do I need to do here?

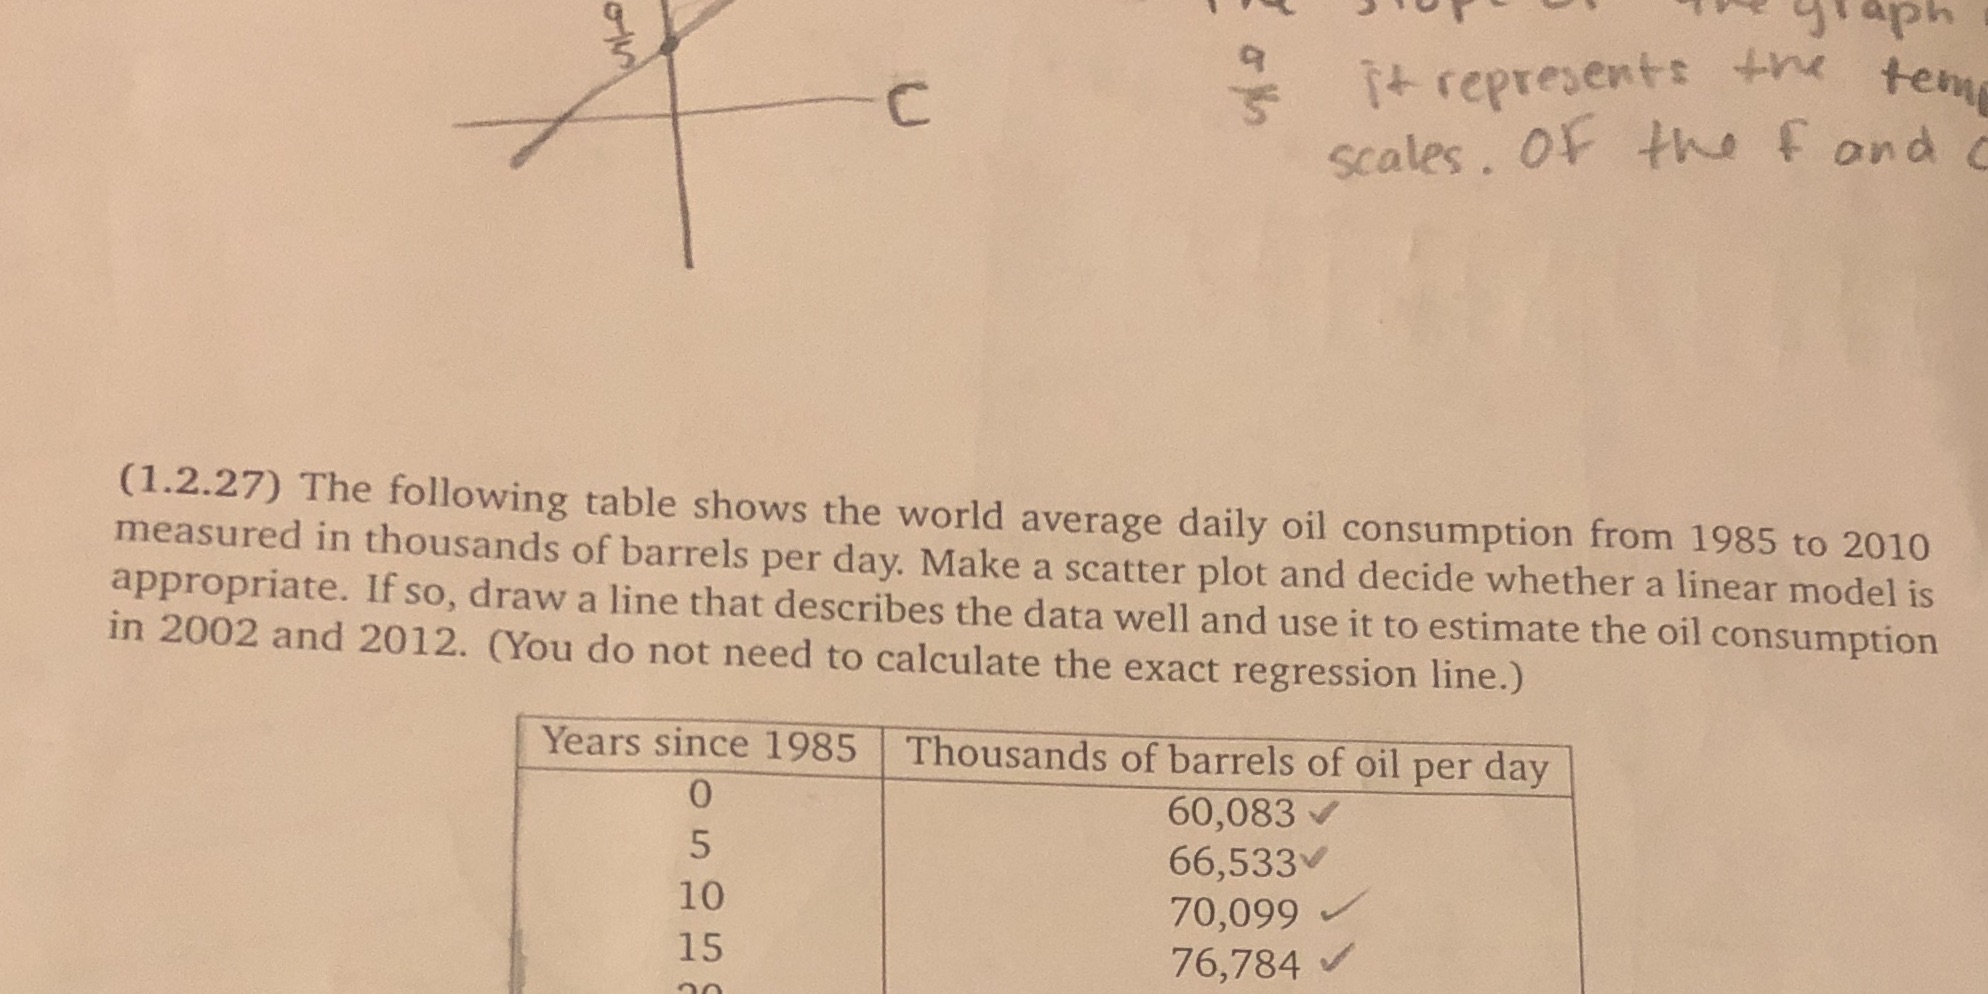
glaph MILO C it represents the tem scales. of the fand (1.2.27) The following table shows the world average daily oil consumption from 1985 to 2010 measured in thousands of barrels per day. Make a scatter plot and decide whether a linear model is appropriate. If so, draw a line that describes the data well and use it to estimate the oil consumption in 2002 and 2012. (You do not need to calculate the exact regression line.) Years since 1985 Thousands of barrels of oil per day 60,083 v 5 66,533 10 70,099 15 76,784
Step by Step Solution
There are 3 Steps involved in it
1 Expert Approved Answer
Step: 1 Unlock

Question Has Been Solved by an Expert!
Get step-by-step solutions from verified subject matter experts
Step: 2 Unlock
Step: 3 Unlock