

Question: What does the calculation of each ratio represent? How does year one compare with year two, and what trend can be seen when you compare
- What does the calculation of each ratio represent?
- How does year one compare with year two, and what trend can be seen when you compare the two years?
- Is the trend from year one to year two positive or negative?
- What are the possible reasons for the trend?
- What recommendations do you have for turning a negative trend to a positive trend?
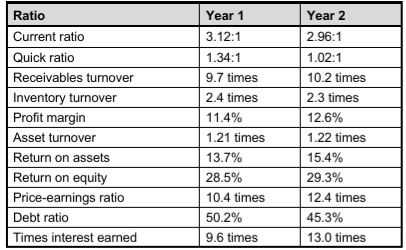
Ratio Year 2 2.96:1 1.02:1 10.2 times Current ratio Quick ratio Receivables turnover Inventory turnover Profit margin Asset turnover Return on assets Return on equity Price-earnings ratio Debt ratio Times interest earned Year 1 3.12:1 1.34:1 9.7 times 2.4 times 11.4% 1.21 times 13.7% 28.5% 10.4 times 50.2% 9.6 times 2.3 times 12.6% 1.22 times 15.4% 29.3% 12.4 times 45.3% 13.0 times
Step by Step Solution
There are 3 Steps involved in it
1 Expert Approved Answer
Step: 1 Unlock

Question Has Been Solved by an Expert!
Get step-by-step solutions from verified subject matter experts
Step: 2 Unlock
Step: 3 Unlock