

Question: What does the data in the sensitivity report indicate? What does the data in the Limits report indicate? Microsoft Excel 16.0 Sensitivity Report Worksheet: [QSO
What does the data in the sensitivity report indicate?
What does the data in the Limits report indicate?
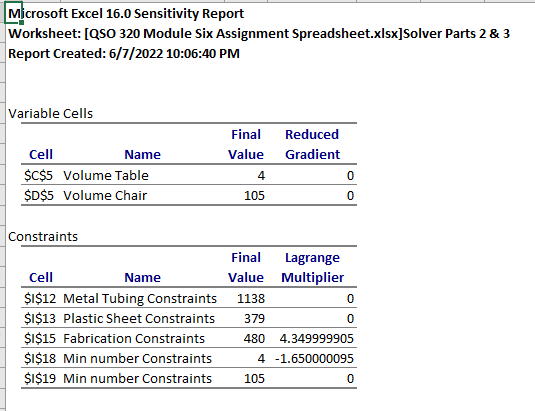
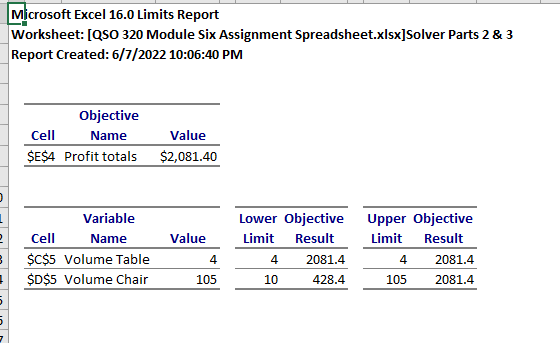
Microsoft Excel 16.0 Sensitivity Report Worksheet: [QSO 320 Module Six Assignment Spreadsheet.xlsx] Solver Parts 2 & 3 Report Created: 6/7/2022 10:06:40 PM Variable Cells Final Reduced Cell Name Value Gradient $C$5 Volume Table 4 0 $D$5 Volume Chair 105 Constraints Final Lagrange Value Multiplier Cell Name 1138 379 $I$12 Metal Tubing Constraints $I$13 Plastic Sheet Constraints $I$15 Fabrication Constraints $I$18 Min number Constraints $I$19 Min number Constraints 480 4.349999905 4 -1.650000095 105 0 3 D Microsoft Excel 16.0 Limits Report Worksheet: [QSO 320 Module Six Assignment Spreadsheet.xlsx]Solver Parts 2 & 3 Report Created: 6/7/2022 10:06:40 PM Objective Cell Name Value $E$4 Profit totals $2,081.40 Lower Objective Upper Objective Variable Name Cell Value Limit Result Limit Result 4 $C$5 Volume Table $D$5 Volume Chair 4 105 10 2081.4 428.4 4 2081.4 105 2081.4Step by Step Solution
There are 3 Steps involved in it
1 Expert Approved Answer
Step: 1 Unlock

Question Has Been Solved by an Expert!
Get step-by-step solutions from verified subject matter experts
Step: 2 Unlock
Step: 3 Unlock