

Question: What does the graph tells? S= are the seconds consume in drawing using (skilled hand) U= sre the seconds consume in drawing using (unskilled hand)
What does the graph tells? S= are the seconds consume in drawing using (skilled hand) U= sre the seconds consume in drawing using (unskilled hand) thank you.
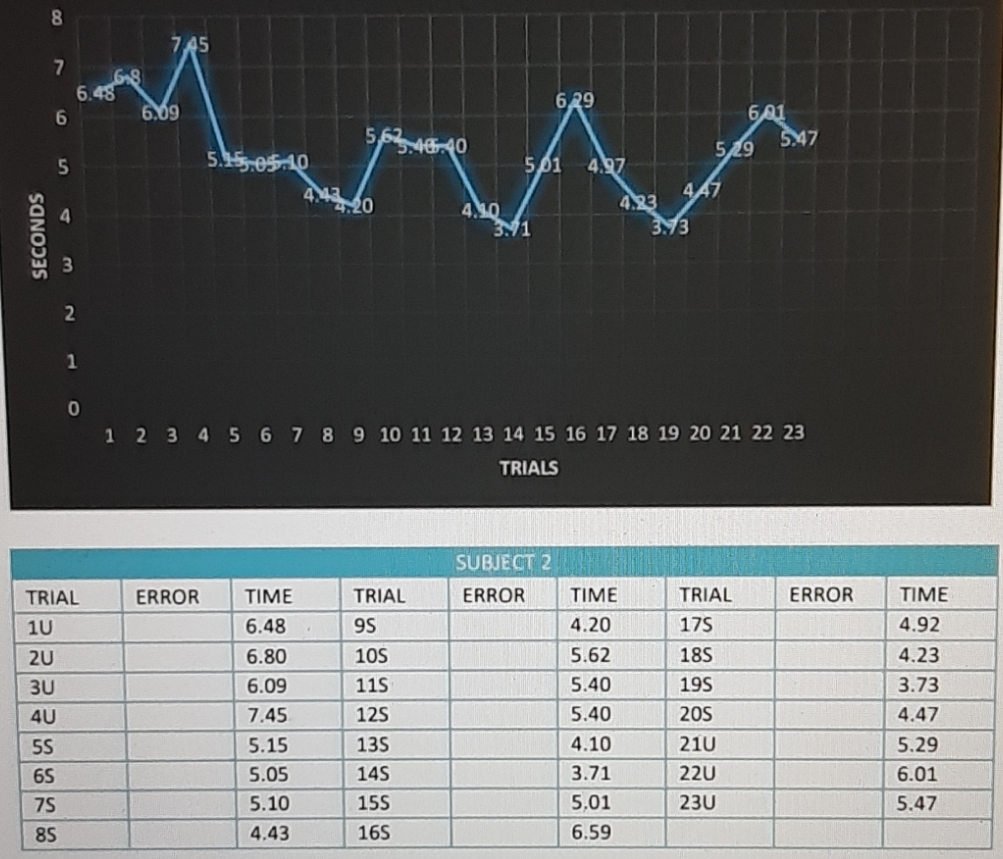
8 N 618 6.48 6.09 6 29 6 601 5.15.05.10 563. 46.40 529 5.47 501 4.97 4:4 4 20 4.23 4/47 A 4.30 SECONDS 3.71 3.73 W N 0 1 2 3 4 5 6 7 8 9 10 11 12 13 14 15 16 17 18 19 20 21 22 23 TRIALS SUBJECT 2 TRIAL ERROR TIME TRIAL ERROR TIME TRIAL ERROR TIME 10 6.48 95 4.20 175 4.92 2U 6.80 10S 5.62 185 4.23 3U 6.09 11S 5.40 195 3.73 4U 7.45 125 5.40 20S 4.47 5S 5.15 135 4.10 210 5.29 65 5.05 14S 3.71 220 6.01 7S 5.10 15S 5.01 230 5.47 85 4.43 165 6.59
Step by Step Solution
There are 3 Steps involved in it
1 Expert Approved Answer
Step: 1 Unlock

Question Has Been Solved by an Expert!
Get step-by-step solutions from verified subject matter experts
Step: 2 Unlock
Step: 3 Unlock