

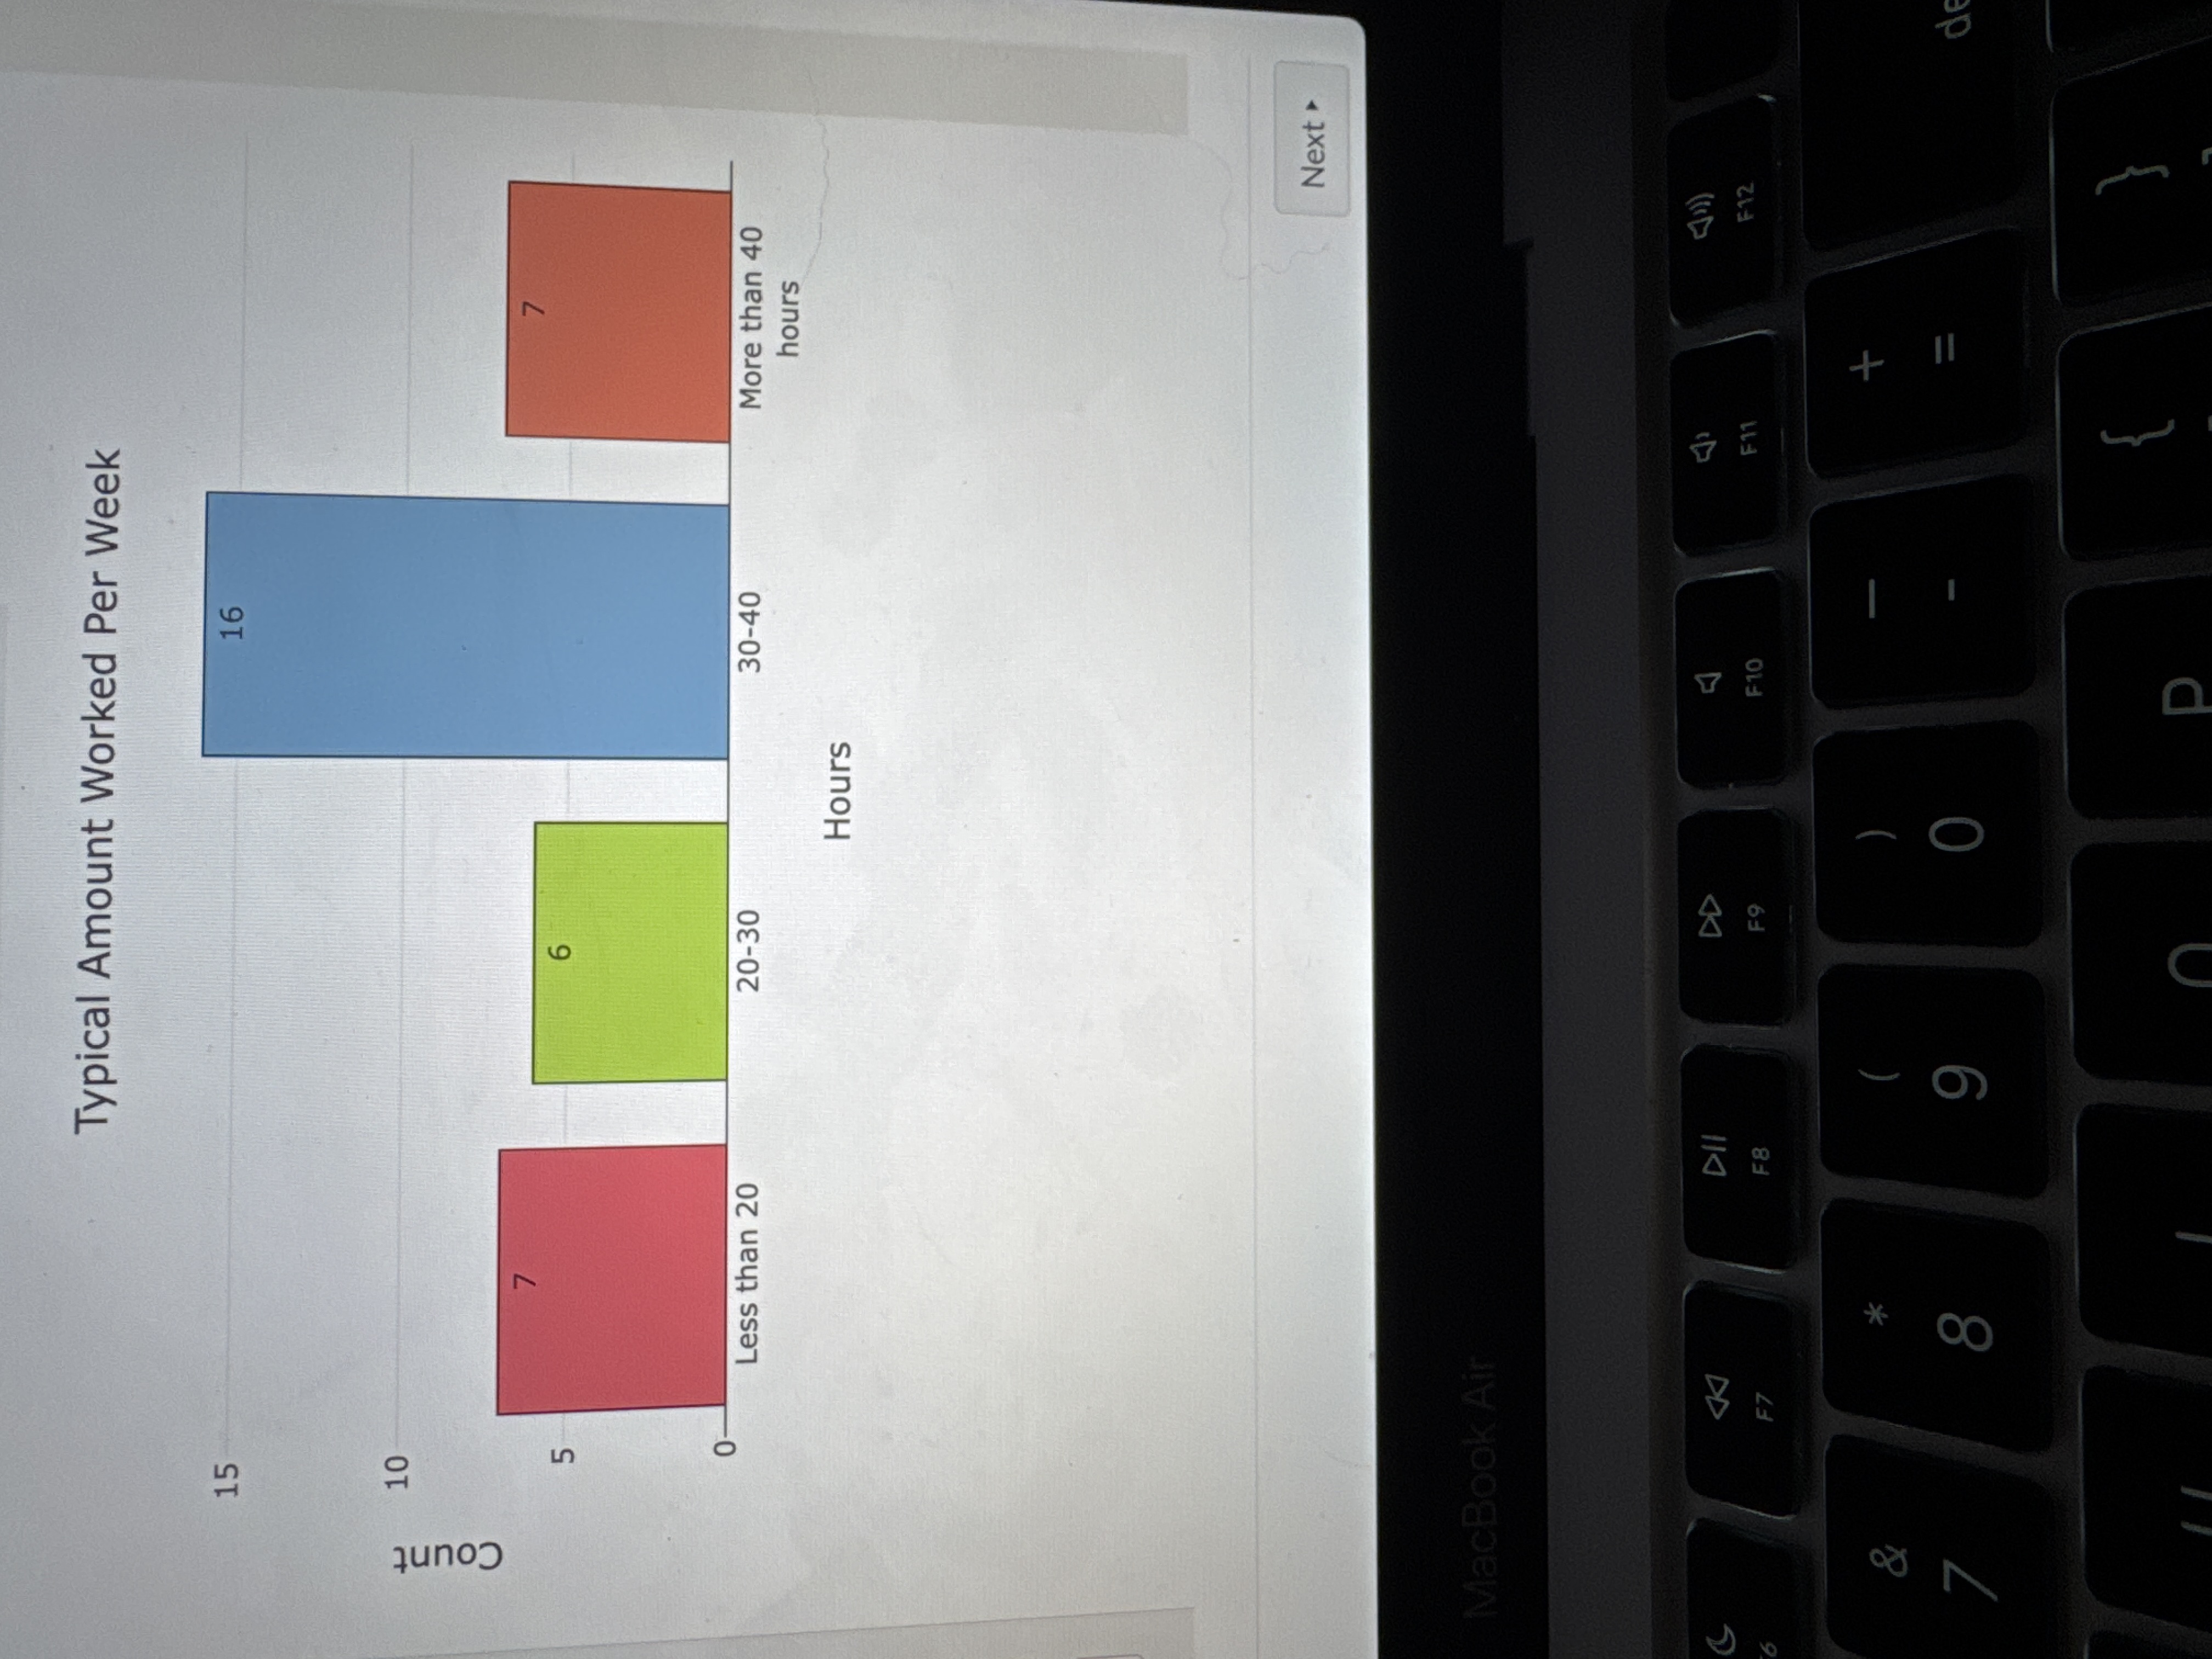
Question: what does this graph tell you Typical Amount Worked Per Week 15 16 10 Count 6 Less than 20 20-30 30-40 More than 40 hours
what does this graph tell you
Step by Step Solution
There are 3 Steps involved in it
1 Expert Approved Answer
Step: 1 Unlock

Question Has Been Solved by an Expert!
Get step-by-step solutions from verified subject matter experts
Step: 2 Unlock
Step: 3 Unlock