

Question: what else do you need? Instructions 1. Go to the CBOE website 2. Select 'Data' the Select 'Quotes Dashboard' 3. In the search window type
 what else do you need?
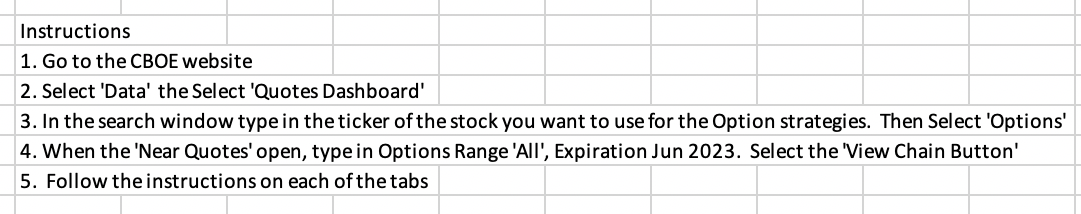
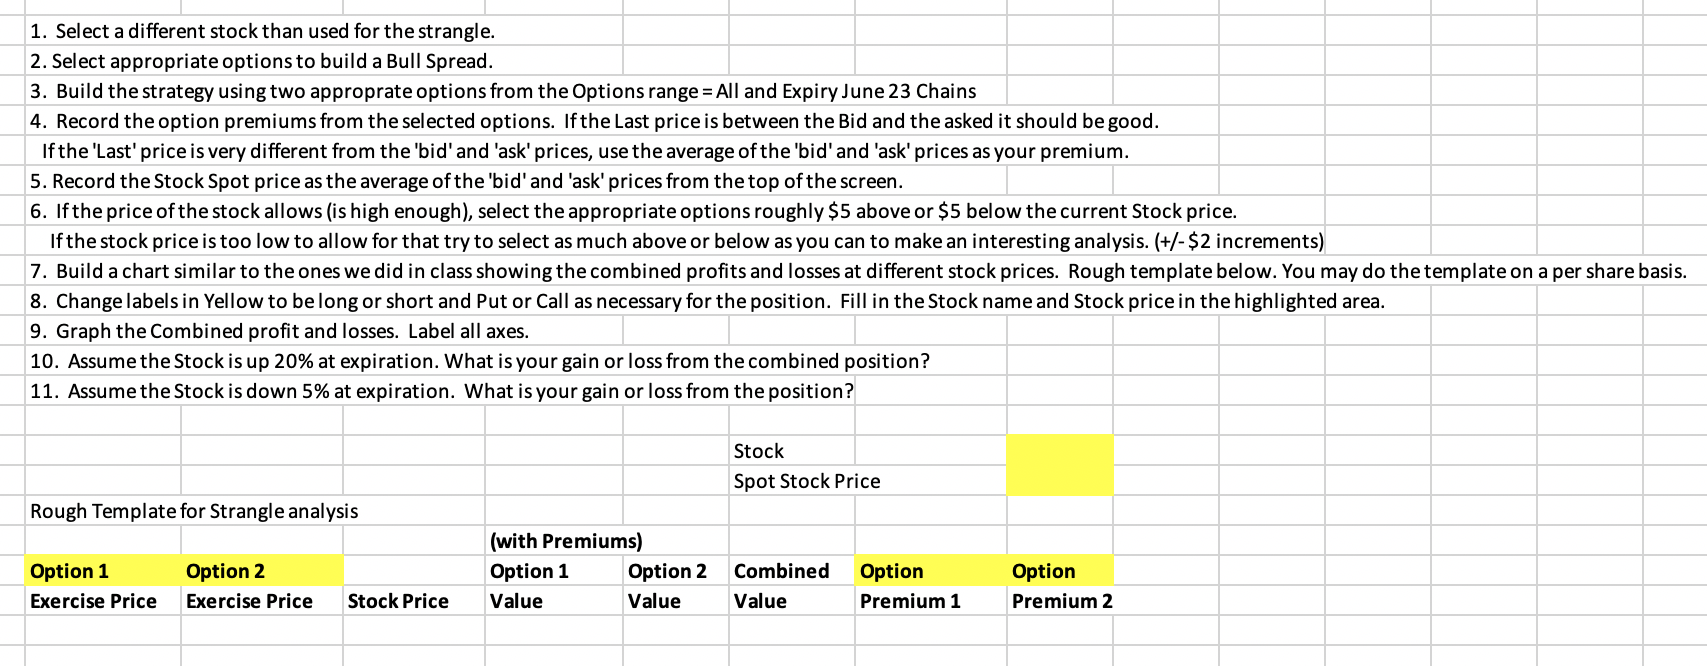
Instructions 1. Go to the CBOE website 2. Select 'Data' the Select 'Quotes Dashboard' 3. In the search window type in the ticker of the stock you want to use for the Option strategies. Then Select 'Options' 4. When the 'Near Quotes' open, type in Options Range 'All', Expiration Jun 2023. Select the 'View Chain Button' 5. Follow the instructions on each of the tabs 1. Select a different stock than used for the strangle. 2. Select appropriate options to build a Bull Spread. 3. Build the strategy using two approprate options from the Options range = All and Expiry June 23 Chains 4. Record the option premiums from the selected options. If the Last price is between the Bid and the asked it should be good. If the 'Last' price is very different from the 'bid' and 'ask' prices, use the average of the 'bid' and 'ask' prices as your premium. 5. Record the Stock Spot price as the average of the 'bid' and 'ask' prices from the top of the screen. 6. If the price of the stock allows (is high enough), select the appropriate options roughly $5 above or $5 below the current Stock price. If the stock price is too low to allow for that try to select as much above or below as you can to make an interesting analysis. (+/- $2 increments) 7. Build a chart similar to the ones we did in class showing the combined profits and losses at different stock prices. Rough template below. You may do the template on a per share basis. 8. Change labels in Yellow to be long or short and Put or Call as necessary for the position. Fill in the Stock name and Stock price in the highlighted area. 9. Graph the Combined profit and losses. Label all axes. 10. Assume the Stock is up 20% at expiration. What is your gain or loss from the combined position? 11. Assume the Stock is down 5% at expiration. What is your gain or loss from the position? Stock Spot Stock Price Rough Template for Strangle analysis (with Premiums) \begin{tabular}{|l|l|l|l|l|l|l|l|} \hline Option 1 & Option 2 & Option 1 & Option 2 & Combined & Option & Option \\ \hline Exercise Price & Exercise Price & Stock Price & Value & Value & Value & Premium 1 & Premium 2 \\ \hline \end{tabular} Instructions 1. Go to the CBOE website 2. Select 'Data' the Select 'Quotes Dashboard' 3. In the search window type in the ticker of the stock you want to use for the Option strategies. Then Select 'Options' 4. When the 'Near Quotes' open, type in Options Range 'All', Expiration Jun 2023. Select the 'View Chain Button' 5. Follow the instructions on each of the tabs 1. Select a different stock than used for the strangle. 2. Select appropriate options to build a Bull Spread. 3. Build the strategy using two approprate options from the Options range = All and Expiry June 23 Chains 4. Record the option premiums from the selected options. If the Last price is between the Bid and the asked it should be good. If the 'Last' price is very different from the 'bid' and 'ask' prices, use the average of the 'bid' and 'ask' prices as your premium. 5. Record the Stock Spot price as the average of the 'bid' and 'ask' prices from the top of the screen. 6. If the price of the stock allows (is high enough), select the appropriate options roughly $5 above or $5 below the current Stock price. If the stock price is too low to allow for that try to select as much above or below as you can to make an interesting analysis. (+/- $2 increments) 7. Build a chart similar to the ones we did in class showing the combined profits and losses at different stock prices. Rough template below. You may do the template on a per share basis. 8. Change labels in Yellow to be long or short and Put or Call as necessary for the position. Fill in the Stock name and Stock price in the highlighted area. 9. Graph the Combined profit and losses. Label all axes. 10. Assume the Stock is up 20% at expiration. What is your gain or loss from the combined position? 11. Assume the Stock is down 5% at expiration. What is your gain or loss from the position? Stock Spot Stock Price Rough Template for Strangle analysis (with Premiums) \begin{tabular}{|l|l|l|l|l|l|l|l|} \hline Option 1 & Option 2 & Option 1 & Option 2 & Combined & Option & Option \\ \hline Exercise Price & Exercise Price & Stock Price & Value & Value & Value & Premium 1 & Premium 2 \\ \hline \end{tabular}
Step by Step Solution
There are 3 Steps involved in it

Get step-by-step solutions from verified subject matter experts