

Question: What explains the difference between the two gaps? Given what the graph states, what is the approximate percentage of RGDP lost in 2018 because of
What explains the difference between the two gaps? Given what the graph states, what is the approximate percentage of RGDP lost in 2018 because of the Great Recession, relative to where the economy could have been had it followed the prerecession trend. Suppose you are the chair of the Fed and you think the right gap is the 2007 version but in fact the 2018 version is the correct gap: how would that impact your choice of monetary policy?
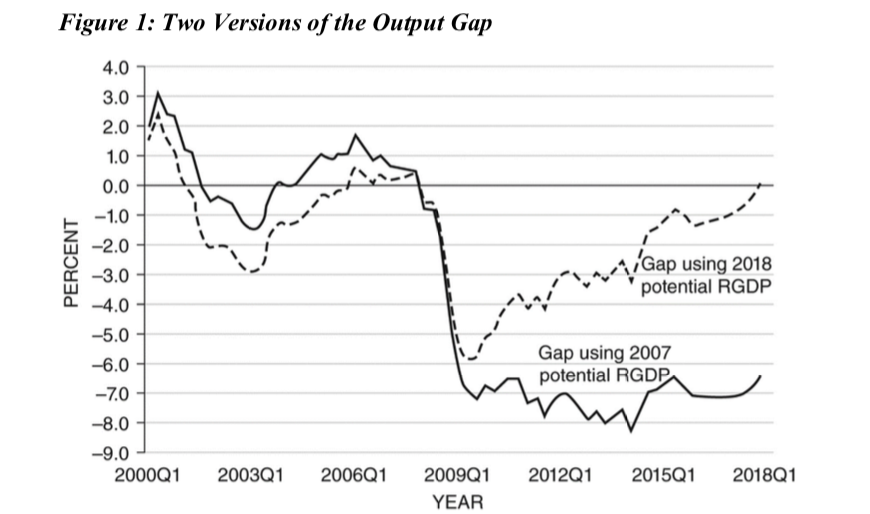
Figure 1: Two Versions of the Output Gap 4.0 3.0 2.0 1.0 0.0 PERCENT -1.0 -2.0 -3.0 Gap using 2018 potential RGDP -4.0 -5.0 -6.0 Gap using 2007 potential RGDP -7.0 -8.0 -9.0 2000Q1 2003Q1 2006Q1 2009Q1 2012Q1 2015Q1 2018Q1 YEAR
Step by Step Solution
There are 3 Steps involved in it

Get step-by-step solutions from verified subject matter experts