

Question: What financial performance issues do you see at UA based on the data in case Exhibits 1, 2, and 3? please do not take the
What financial performance issues do you see at UA based on the data in case Exhibits 1, 2, and 3? please do not take the answers that already here on Chegg
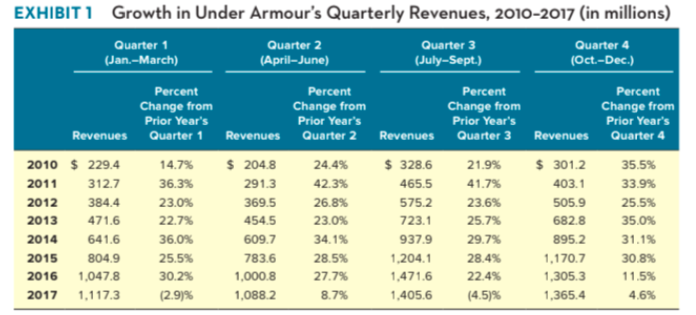
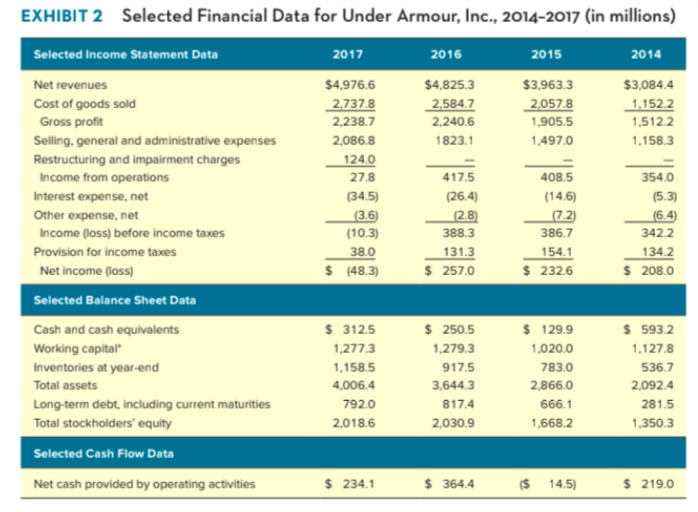
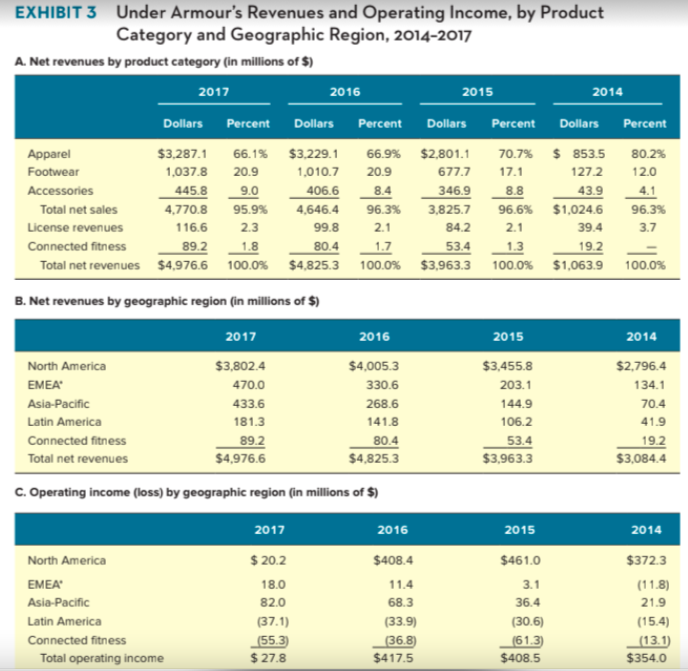
EXHIBITI Growth in Under Armour's Quarterly Revenues, 2010-2017 (in millions) Quarter 1 Quarter 2 Quarter 3 Quarter 4 (Jan-March) (April-June) (July-Sept.) (Oct-Dec.) Percent Percent Percent Percent Change from Change from Change from Change from Prior Year's Prior Year's Prior Year's Prior Year's Revenues Quarter 1 Revenues Quarter 2 Revenues Quarter 3 Revenues Quarter 4 2010 $ 229.4 14.7% $ 204.8 24.4% $ 328.6 21.9% $ 301.2 35.5% 2011 312.7 36.3% 291.3 42.3% 465.5 41.7% 403.1 33.9% 2012 384.4 23.0% 369.5 26.8% 5752 23.6% 505.9 25.5% 2013 471.6 22.7% 454.5 23.0% 723.1 25.7% 682.8 35.0% 2014 641.6 36.0% 609.7 34.1% 937.9 29.7% 895.2 31.1% 2015 804.9 25.5% 783.6 28.5% 1,204.1 28.4% 1,170.7 30.8% 2016 1.047.8 30.2% 1,000.8 27.7% 1.471.6 22.4% 1,305,3 11.5% 2017 1.117.3 (2.9% 1,088.2 8.7% 1,405.6 (4.5% 1,365.4 4.6% EXHIBIT 2 Selected Financial Data for Under Armour, Inc., 2014-2017 (in millions) 2017 2016 2015 2014 $4,825.3 2,584.7 2,240.6 1823.1 $3,963.3 2,057.8 1,905.5 1,497.0 $3,084.4 1,152.2 1,512.2 1,158.3 $4,976.6 2,737.8 2,238.7 2,086.8 124.0 27.8 (34.5) (3.6 (10.3) 38.0 $ (48.3) 354.0 Selected Income Statement Data Net revenues Cost of goods sold Gross profit Selling, general and administrative expenses Restructuring and impairment charges Income from operations Interest expense, net Other expense, net Income (loss) before income taxes Provision for income taxes Net income (loss) Selected Balance Sheet Data Cash and cash equivalents Working capital Inventories at year-end Total assets Long-term debt, including current maturities Total stockholders' equity Selected Cash Flow Data 417.5 (26.4) (2.8) 388.3 131.3 $ 257.0 408.5 (14.6) (7.2) 386.7 154.1 $ 232.6 (5.3) 16.4 3422 134.2 $ 208.0 $ 312.5 1,277.3 1,158.5 4,006.4 7920 2,018.6 $ 250.5 1,279.3 917.5 3,644.3 817.4 2,030.9 $ 129.9 1,020.0 783.0 2,866.0 666.1 1,668.2 $ 593.2 1,127.8 536.7 2,092.4 281.5 1,350.3 Net cash provided by operating activities $ 234.1 $364.4 $ 14.5) $ 219,0 EXHIBIT 3 Under Armour's Revenues and Operating Income, by Product Category and Geographic Region, 2014-2017 A. Net revenues by product category (in millions of $) 2017 2016 2015 2014 Dollars Percent Dollars Percent Dollars Percent Dollars Percent Apparel $3,287.1 66.1% $3,229.1 66.9% $2,801.1 70.7% $ 853.5 80.2% Footwear 1,037.8 20.9 1,010.7 20.9 677.7 127.2 Accessories 445.8 9.0 406.6 8.4 346.9 43.9 4.1 Total net sales 4.770.8 95.9% 4,646.4 96.3% 3,825.7 $1,024.6 License revenues Connected fitness 89.2 1.8 80.4 53.4 1.3 19.2 Total net revenues $4,976.6 100.0% $4,825.3 100.0% $3,963.3 100.0% $1,063.9 100.0% 12.0 17.1 8.8 96.6% 2.1 96.3% 3.7 116.6 2.3 99.8 2.1 84.2 39.4 1.7 B. Net revenues by geographic region (in millions of $) 2017 2016 2014 North America $3,802.4 $4,005.3 EMEA 470.0 330.6 Asia-Pacific 433.6 268.6 Latin America 181.3 141.8 Connected fitness 89.2 80.4 Total net revenues $4,976.6 $4,825.3 C. Operating income (loss) by geographic region (in millions of $) 2015 $3,455.8 203.1 144.9 106.2 53.4 $3,963.3 $2,796.4 134.1 70.4 41.9 19.2 $3,084.4 2017 2016 2015 2014 North America EMEA Asia-Pacific Latin America Connected fitness Total operating income $ 20.2 18.0 82.0 (37.1) (55.3 $ 27.8 $408.4 11.4 68.3 (33.9) (36.8) $417.5 $461,0 3.1 36.4 (30.6) (61.3 $408.5 $372.3 (11.8) 21.9 (15.4) (13.1 $354.0Step by Step Solution
There are 3 Steps involved in it
1 Expert Approved Answer
Step: 1 Unlock

Question Has Been Solved by an Expert!
Get step-by-step solutions from verified subject matter experts
Step: 2 Unlock
Step: 3 Unlock