

Question: What formula do I need to use here? (Excel) Allocation for calculating expected portfolio return if you were invested in each fund based on the
What formula do I need to use here? (Excel) Allocation for calculating expected portfolio return if you were invested in each fund based on the percentages listed.
I know this is an unconventional request, but thank you.
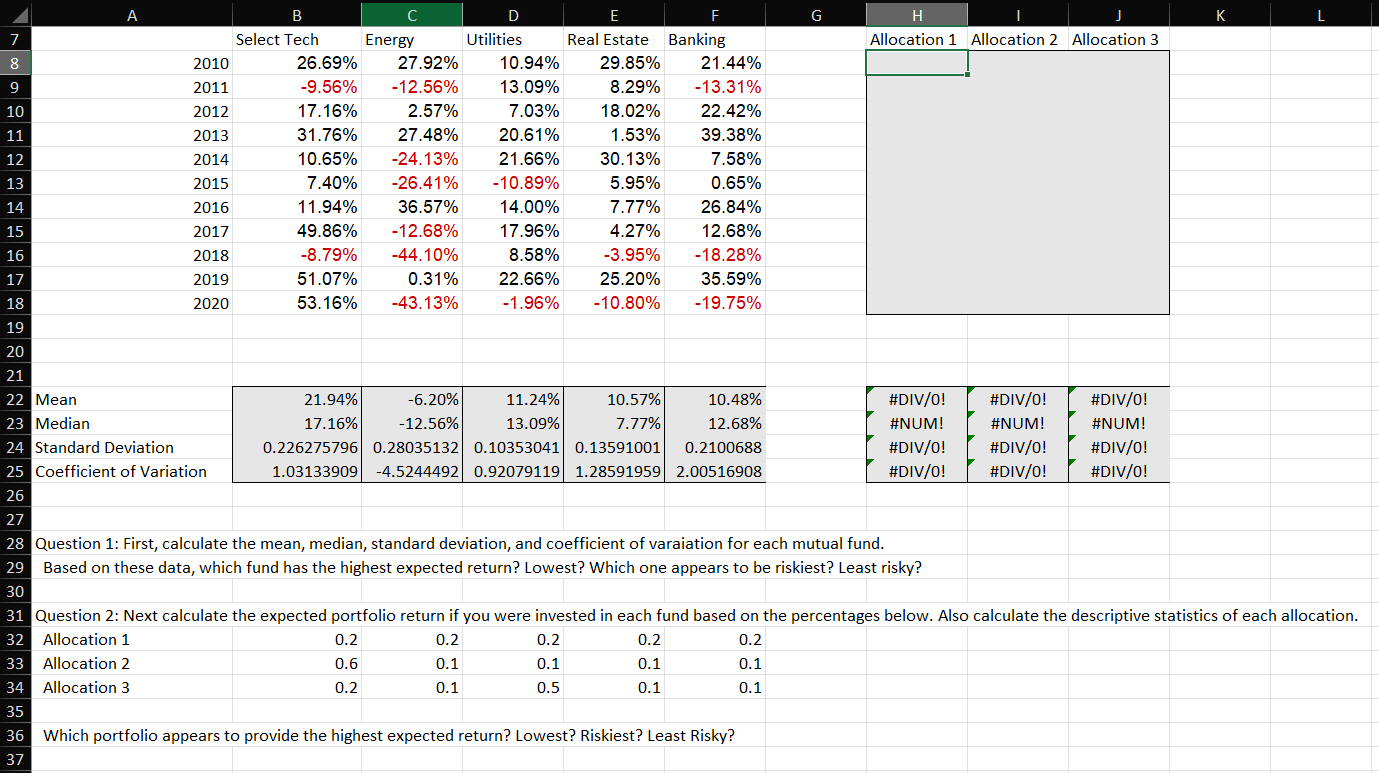
G K L H Allocation 1 Allocation 2 Allocation 3 7 8 9 10 11 12 13 14 15 B D Select Tech Energy Utilities Real Estate Banking 2010 26.69% 27.92% 10.94% 29.85% 21.44% 2011 -9.56% -12.56% 13.09% 8.29% -13.31% 2012 17.16% 2.57% 7.03% 18.02% 22.42% 2013 31.76% 27.48% 20.61% 1.53% 39.38% 2014 10.65% -24.13% 21.66% 30.13% 7.58% 2015 7.40% -26.41% -10.89% 5.95% 0.65% 2016 11.94% 36.57% 14.00% 7.77% 26.84% 2017 49.86% -12.68% 17.96% 4.27% 12.68% 2018 -8.79% -44.10% 8.58% -3.95% -18.28% 2019 51.07% 0.31% 22.66% 25.20% 35.59% 2020 53.16% -43.13% -1.96% -10.80% -19.75% 16 17 18 19 20 21 22 Mean 21.94% -6.20% 11.24% 10.57% 10.48% #DIV/0! #DIV/0! #DIV/0! 23 Median 17.16% -12.56% 13.09% 7.77% 12.68% #NUM! #NUM! #NUM! 24 Standard Deviation 0.226275796 0.28035132 0.10353041 0.13591001 0.2100688 #DIV/0! #DIV/0! #DIV/0! 25 Coefficient of Variation 1.03133909 -4.5244492 0.92079119 1.28591959 2.00516908 #DIV/0! #DIV/0! #DIV/0! 26 27 28 Question 1: First, calculate the mean, median, standard deviation, and coefficient of varaiation for each mutual fund. 29 Based on these data, which fund has the highest expected return? Lowest? Which one appears to be riskiest? Least risky? 30 31 Question 2: Next calculate the expected portfolio return if you were invested in each fund based on the percentages below. Also calculate the descriptive statistics of each allocation. 32 Allocation 1 0.2 0.2 0.2 0.2 0.2 33 Allocation 2 0.6 0.1 0.1 0.1 0.1 34 Allocation 3 0.2 0.1 0.5 0.1 0.1 35 36 Which portfolio appears to provide the highest expected return? Lowest? Riskiest? Least Risky? 37 G K L H Allocation 1 Allocation 2 Allocation 3 7 8 9 10 11 12 13 14 15 B D Select Tech Energy Utilities Real Estate Banking 2010 26.69% 27.92% 10.94% 29.85% 21.44% 2011 -9.56% -12.56% 13.09% 8.29% -13.31% 2012 17.16% 2.57% 7.03% 18.02% 22.42% 2013 31.76% 27.48% 20.61% 1.53% 39.38% 2014 10.65% -24.13% 21.66% 30.13% 7.58% 2015 7.40% -26.41% -10.89% 5.95% 0.65% 2016 11.94% 36.57% 14.00% 7.77% 26.84% 2017 49.86% -12.68% 17.96% 4.27% 12.68% 2018 -8.79% -44.10% 8.58% -3.95% -18.28% 2019 51.07% 0.31% 22.66% 25.20% 35.59% 2020 53.16% -43.13% -1.96% -10.80% -19.75% 16 17 18 19 20 21 22 Mean 21.94% -6.20% 11.24% 10.57% 10.48% #DIV/0! #DIV/0! #DIV/0! 23 Median 17.16% -12.56% 13.09% 7.77% 12.68% #NUM! #NUM! #NUM! 24 Standard Deviation 0.226275796 0.28035132 0.10353041 0.13591001 0.2100688 #DIV/0! #DIV/0! #DIV/0! 25 Coefficient of Variation 1.03133909 -4.5244492 0.92079119 1.28591959 2.00516908 #DIV/0! #DIV/0! #DIV/0! 26 27 28 Question 1: First, calculate the mean, median, standard deviation, and coefficient of varaiation for each mutual fund. 29 Based on these data, which fund has the highest expected return? Lowest? Which one appears to be riskiest? Least risky? 30 31 Question 2: Next calculate the expected portfolio return if you were invested in each fund based on the percentages below. Also calculate the descriptive statistics of each allocation. 32 Allocation 1 0.2 0.2 0.2 0.2 0.2 33 Allocation 2 0.6 0.1 0.1 0.1 0.1 34 Allocation 3 0.2 0.1 0.5 0.1 0.1 35 36 Which portfolio appears to provide the highest expected return? Lowest? Riskiest? Least Risky? 37
Step by Step Solution
There are 3 Steps involved in it

Get step-by-step solutions from verified subject matter experts