

Question: what formula would you plug into the first yellow box(m43) to predict revenue for media networks in fy2022E Forecasts of multi-segment businesses are developed as
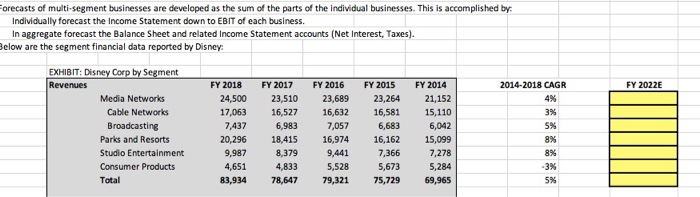
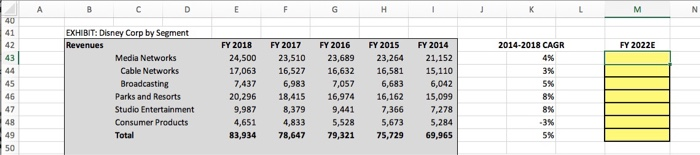
Forecasts of multi-segment businesses are developed as the sum of the parts of the individual businesses. This is accomplished by: Individually forecast the Income Statement down to EBIT of each business. In aggregate forecast the Balance Sheet and related Income Statement accounts (Net Interest, Taxes). Below are the segment financial data reported by Disney: 2014-2018 CAGR FY 2022E EXHIBIT: Disney Corp by Segment Revenues Media Networks Cable Networks Broadcasting Parks and Resorts Studio Entertainment Consumer Products Total 5% FY 2018 24,500 17,063 7,437 20,296 9,987 4,651 83,934 FY 2017 FY 2016 FY 2015 23,510 23,689 23,264 16,527 16,632 16,581 6,983 7,057 6,683 18,415 16,974 16,162 8,3799,441 4417,366 4,833 5,528 5,673 78,647 79,321 75,729 FY 2014 21,152 15,110 6,042 15,099 7,278 5,284 69,965 8% 5% 2014-2018 CAGR Y 2022E EXHIBIT: Disney Corp by Segment Revenues Media Networks Cable Networks Broadcasting Parks and Resorts Studio Entertainment Consumer Products Total FY 2018 24,500 17,063 7,437 20,296 9,987 4,651 83,934 FY 2017 23,510 16,527 6,983 18,415 8,379 4,833 78,647 FY 2016 23,689 16,632 7,057 16,974 9,441 5,528 79,321 FY 2015 23,264 16,581 6,683 16,162 7,366 5,673 75,729 FY 2014 21,152 15,110 6,042 15,099 7,278 5,284 69,965
Step by Step Solution
There are 3 Steps involved in it

Get step-by-step solutions from verified subject matter experts