

Question: What Formulas do I input to solve the tables? Share , - - UTF-8ch08_student%281%290 File Edit View Insert Format Data Tools Add-ons Help Last edit
 What Formulas do I input to solve the tables?
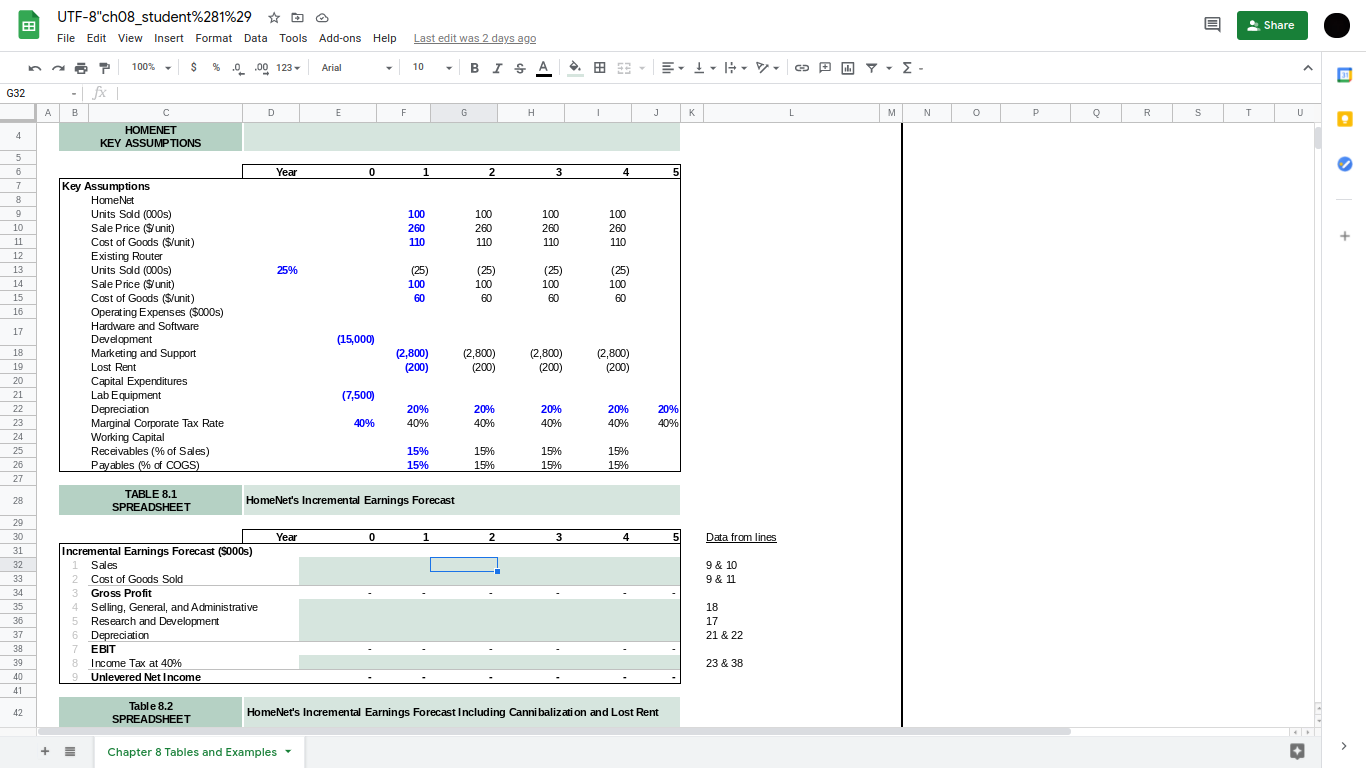
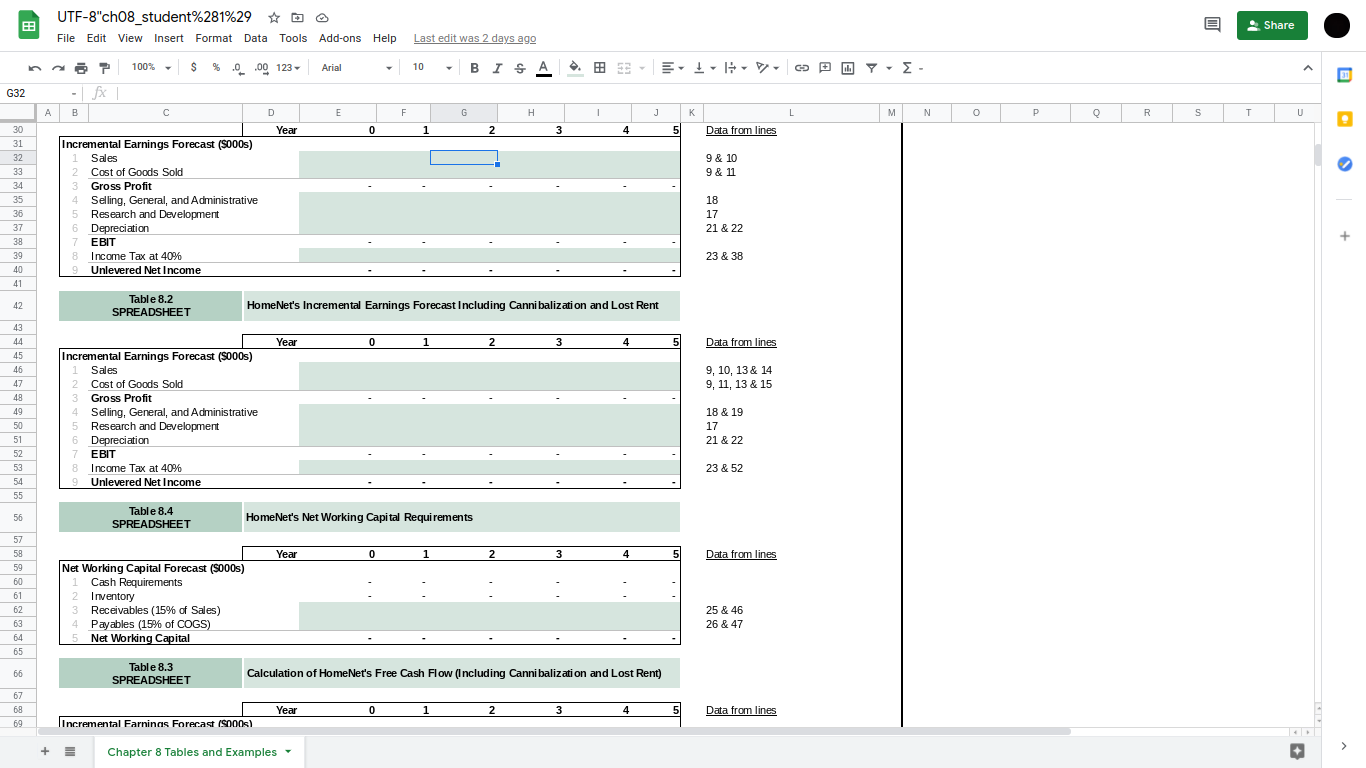
Share , - - UTF-8"ch08_student%281%290 File Edit View Insert Format Data Tools Add-ons Help Last edit was 2 days ago 100% $% 0.00 123 Arial - 10 -BISA - fx B E F G . HOMENET KEY ASSUMPTIONS G32 A D 1 J K L M M N o O R S T U 4 Year 0 1 2 3 4 5 5 6 6 7 8 9 100 260 110 100 260 110 100 260 110 100 260 110 10 11 12 13 25% 14 15 (25) 100 60 (25) 100 60 (25) 100 60 (25) 100 60 16 Key Assumptions HomeNet Units Sold (000s) Sale Price ($/unit) Cost of Goods ($/unit) Existing Router Units Sold (000s) Sale Price ($/unit) Cost of Goods ($/unit) Operating Expenses ($000s) Hardware and Software Development Marketing and Support Lost Rent Capital Expenditures Lab Equipment Depreciation Marginal Corporate Tax Rate Working Capital Receivables (% of Sales) Payables (% of COGS) 17 (15,000) (2,800) (2,800) (2,800) (200) (2,800) (200) (200) (200) (7,500) 18 19 20 21 22 23 24 25 26 27 20% 40% 20% 40% 20% 40% 20% 40% 20% 40% 40% 15% 15% 15% 15% 15% 15% 15% 15% 28 TABLE 8.1 SPREADSHEET HomeNet's Incremental Earnings Forecast Year 0 1 2 3 4 5 Data from lines 29 30 31 32 33 34 35 9 & 10 9 & 11 Incremental Earnings Forecast (S000s) 1 Sales 2 Cost of Goods Sold 3 Gross Profit Selling, General, and Administrative 5 Research and Development 6 Depreciation 7 EBIT 8 Income Tax at 40% 9 Unlevered Net Income 18 17 21 & 22 36 37 38 39 23 & 38 40 41 42 Table 8.2 SPREADSHEET HomeNet's Incremental Earnings Forecast Including Cannibalization and Lost Rent + Chapter 8 Tables and Examples Share 53 IV POY- G32 A 1 J K L M M N o O R S T U 4 5 Data from lines UTF-8"ch08_student%281%290 File Edit View Insert Format Data Tools Add-ons Help Last edit was 2 days ago 100% - S % .0 .00 123 Arial - 10 BIGA - fx B D E F H Year 0 1 2 3 Incremental Earnings Forecast (S000s) Sales Cost of Goods Sold 3 Gross Profit Selling, General, and Administrative 5 Research and Development Depreciation 7 EBIT 8 Income Tax at 40% 9 Unlevered Net Income 30 31 32 33 34 35 36 37 38 39 40 41 9 & 10 9 & 11 18 17 21 & 22 23 & 38 42 Table 8.2 SPREADSHEET HomeNet's Incremental Earnings Forecast Including Cannibalization and Lost Rent 43 44 Year 0 1 2 3 4 5 Data from lines 45 46 9, 10, 13 & 14 9, 11, 13 & 15 47 48 49 50 51 52 53 54 55 Incremental Earnings Forecast (S000s) Sales 2 Cost of Goods Sold 3 Gross Profit Selling, General, and Administrative Research and Development Depreciation 7 EBIT 8 Income Tax at 40% 9 Unlevered Net Income 18 & 19 17 21 & 22 23 & 52 56 Table 8.4 SPREADSHEET HomeNet's Net Working Capital Requirements Year 0 1 2 3 4 5 Data from lines 57 58 59 60 61 62 63 64 65 Net Working Capital Forecast (S000s) Cash Requirements 2 Inventory 3 Receivables (15% of Sales) 4 Payables (15% of COGS) 5 Net Working Capital 25 & 46 26 & 47 66 Table 8.3 SPREADSHEET Calculation of HomeNet's Free Cash Flow (Including Cannibalization and Lost Rent) 67 68 69 Year 0 1 2 3 4 5. Data from lines Incremental Farninas Forecast (9000) + Chapter 8 Tables and Examples Share , - - UTF-8"ch08_student%281%290 File Edit View Insert Format Data Tools Add-ons Help Last edit was 2 days ago 100% $% 0.00 123 Arial - 10 -BISA - fx B E F G . HOMENET KEY ASSUMPTIONS G32 A D 1 J K L M M N o O R S T U 4 Year 0 1 2 3 4 5 5 6 6 7 8 9 100 260 110 100 260 110 100 260 110 100 260 110 10 11 12 13 25% 14 15 (25) 100 60 (25) 100 60 (25) 100 60 (25) 100 60 16 Key Assumptions HomeNet Units Sold (000s) Sale Price ($/unit) Cost of Goods ($/unit) Existing Router Units Sold (000s) Sale Price ($/unit) Cost of Goods ($/unit) Operating Expenses ($000s) Hardware and Software Development Marketing and Support Lost Rent Capital Expenditures Lab Equipment Depreciation Marginal Corporate Tax Rate Working Capital Receivables (% of Sales) Payables (% of COGS) 17 (15,000) (2,800) (2,800) (2,800) (200) (2,800) (200) (200) (200) (7,500) 18 19 20 21 22 23 24 25 26 27 20% 40% 20% 40% 20% 40% 20% 40% 20% 40% 40% 15% 15% 15% 15% 15% 15% 15% 15% 28 TABLE 8.1 SPREADSHEET HomeNet's Incremental Earnings Forecast Year 0 1 2 3 4 5 Data from lines 29 30 31 32 33 34 35 9 & 10 9 & 11 Incremental Earnings Forecast (S000s) 1 Sales 2 Cost of Goods Sold 3 Gross Profit Selling, General, and Administrative 5 Research and Development 6 Depreciation 7 EBIT 8 Income Tax at 40% 9 Unlevered Net Income 18 17 21 & 22 36 37 38 39 23 & 38 40 41 42 Table 8.2 SPREADSHEET HomeNet's Incremental Earnings Forecast Including Cannibalization and Lost Rent + Chapter 8 Tables and Examples Share 53 IV POY- G32 A 1 J K L M M N o O R S T U 4 5 Data from lines UTF-8"ch08_student%281%290 File Edit View Insert Format Data Tools Add-ons Help Last edit was 2 days ago 100% - S % .0 .00 123 Arial - 10 BIGA - fx B D E F H Year 0 1 2 3 Incremental Earnings Forecast (S000s) Sales Cost of Goods Sold 3 Gross Profit Selling, General, and Administrative 5 Research and Development Depreciation 7 EBIT 8 Income Tax at 40% 9 Unlevered Net Income 30 31 32 33 34 35 36 37 38 39 40 41 9 & 10 9 & 11 18 17 21 & 22 23 & 38 42 Table 8.2 SPREADSHEET HomeNet's Incremental Earnings Forecast Including Cannibalization and Lost Rent 43 44 Year 0 1 2 3 4 5 Data from lines 45 46 9, 10, 13 & 14 9, 11, 13 & 15 47 48 49 50 51 52 53 54 55 Incremental Earnings Forecast (S000s) Sales 2 Cost of Goods Sold 3 Gross Profit Selling, General, and Administrative Research and Development Depreciation 7 EBIT 8 Income Tax at 40% 9 Unlevered Net Income 18 & 19 17 21 & 22 23 & 52 56 Table 8.4 SPREADSHEET HomeNet's Net Working Capital Requirements Year 0 1 2 3 4 5 Data from lines 57 58 59 60 61 62 63 64 65 Net Working Capital Forecast (S000s) Cash Requirements 2 Inventory 3 Receivables (15% of Sales) 4 Payables (15% of COGS) 5 Net Working Capital 25 & 46 26 & 47 66 Table 8.3 SPREADSHEET Calculation of HomeNet's Free Cash Flow (Including Cannibalization and Lost Rent) 67 68 69 Year 0 1 2 3 4 5. Data from lines Incremental Farninas Forecast (9000) + Chapter 8 Tables and Examples
Step by Step Solution
There are 3 Steps involved in it

Get step-by-step solutions from verified subject matter experts