

Question: What Happens When Joggers Get Mad? Complete each table. Write the letter of each table value in the box above the corresponding value at the
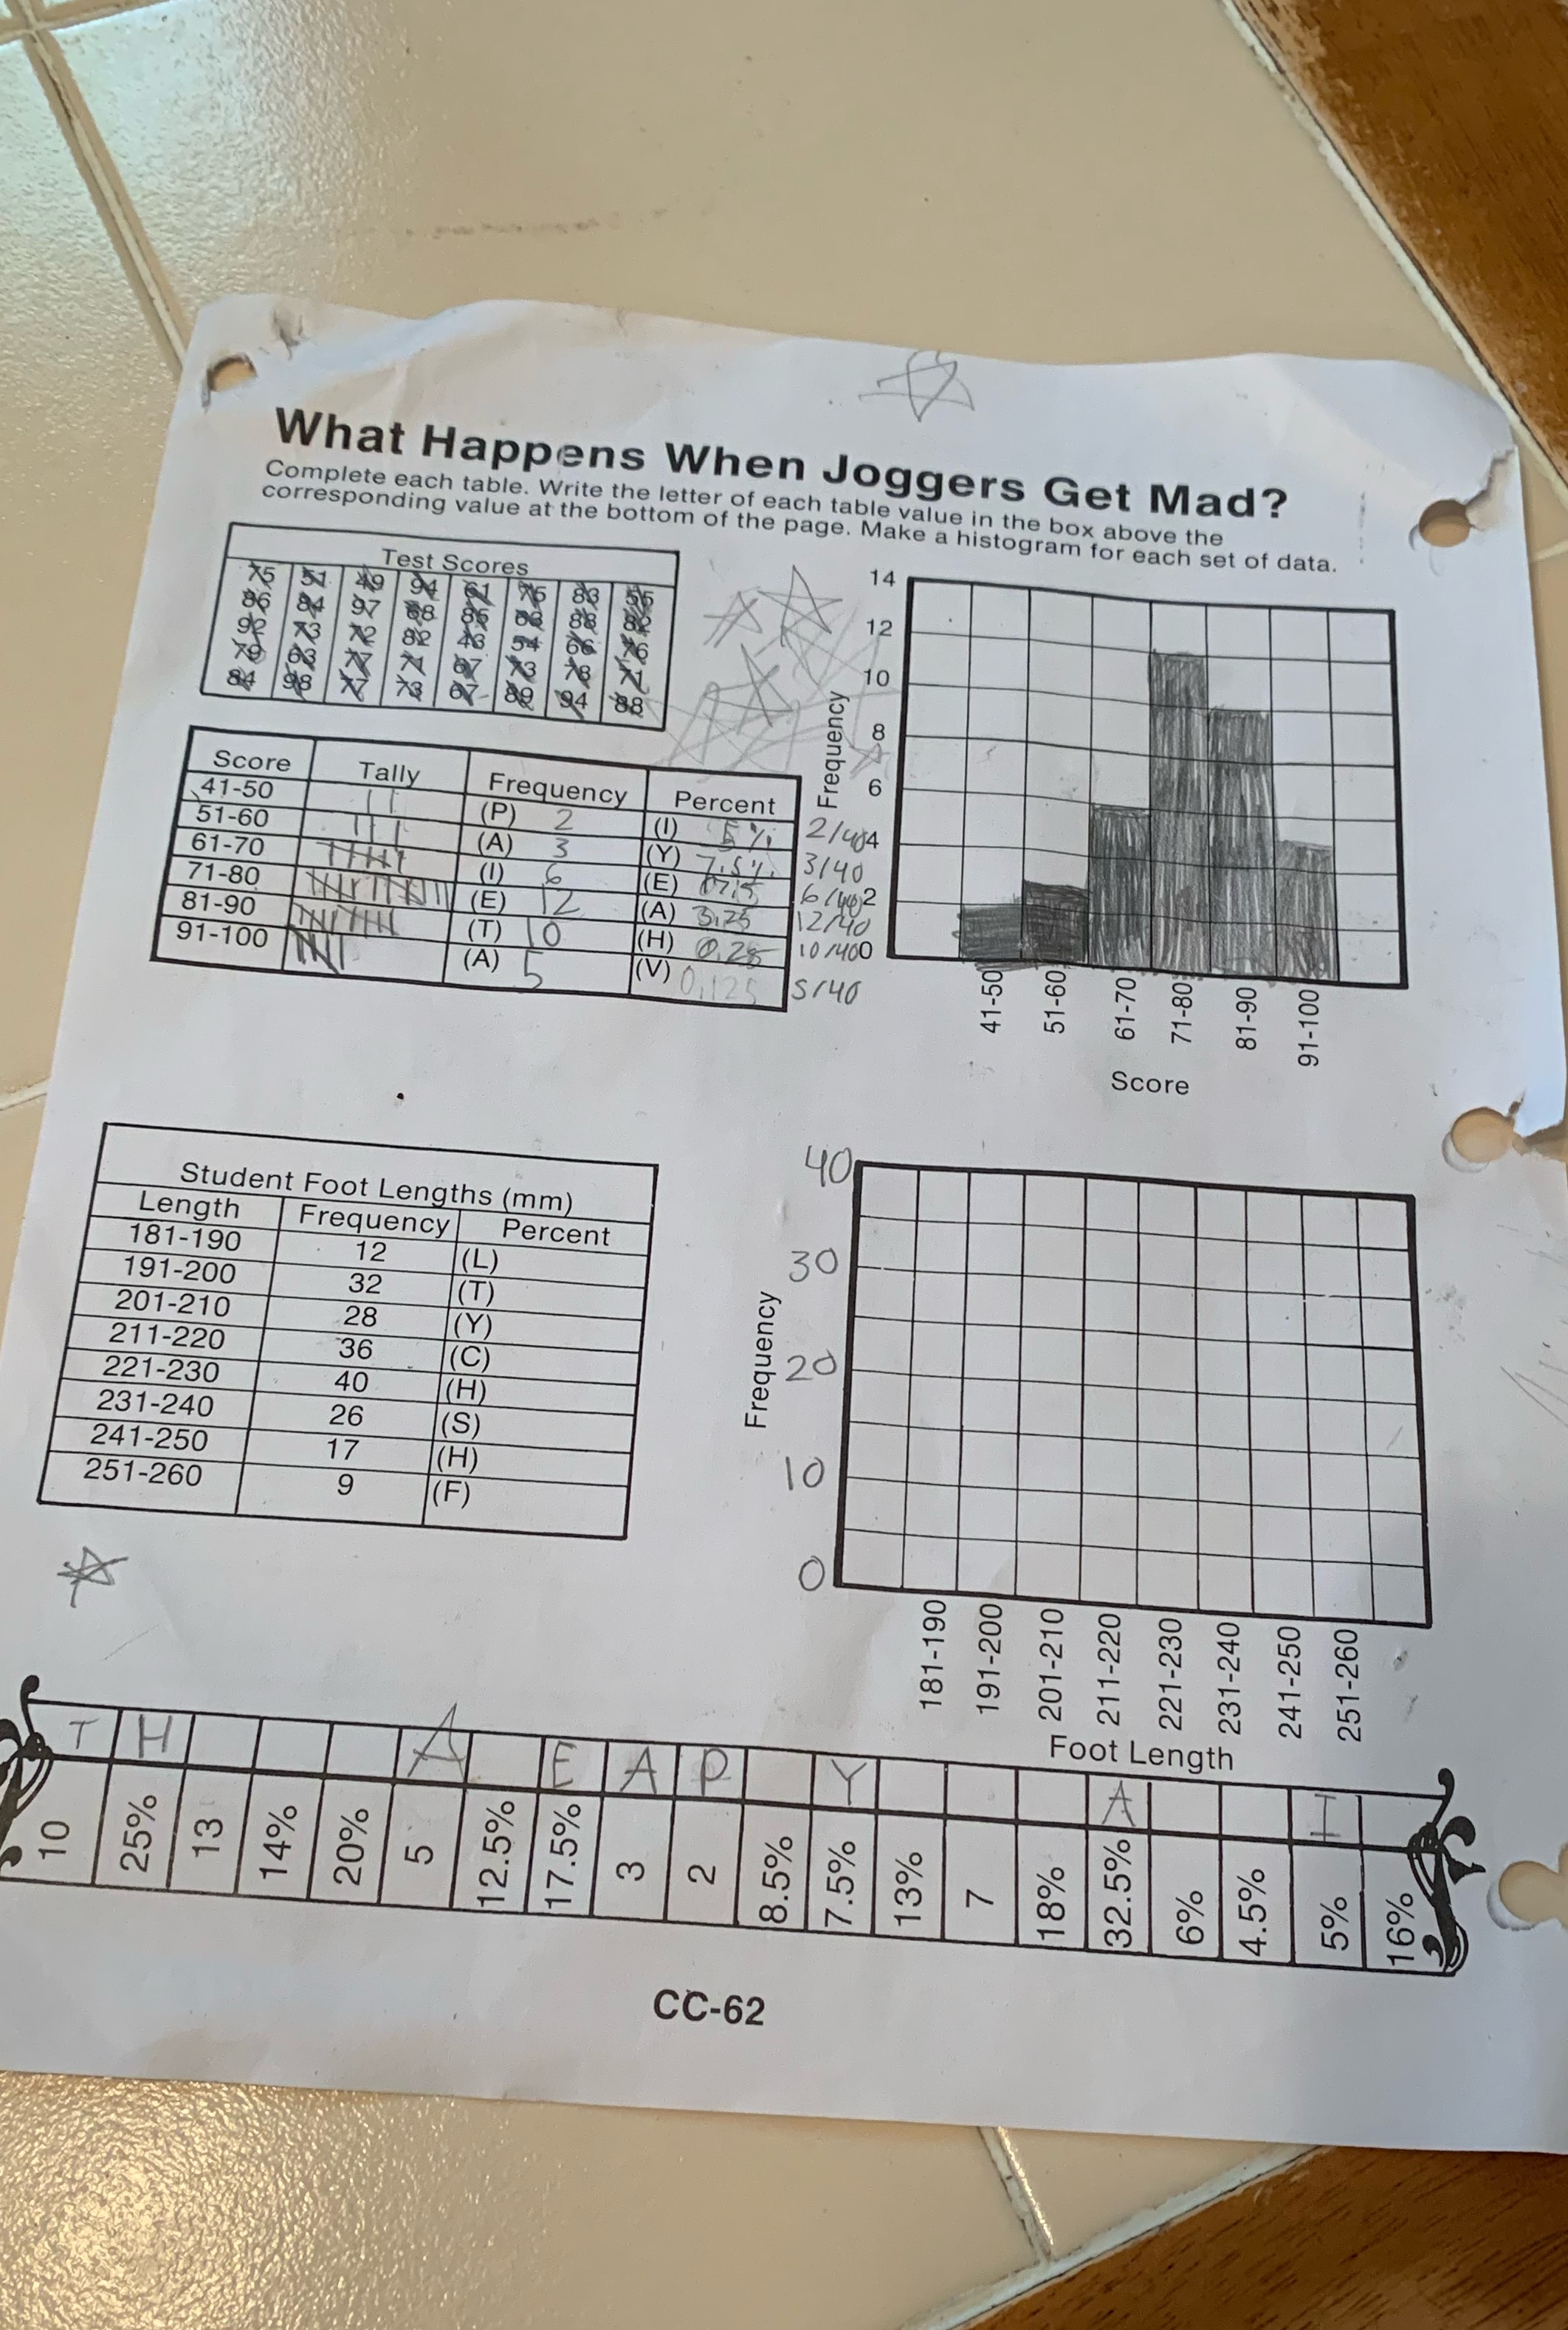
What Happens When Joggers Get Mad? Complete each table. Write the letter of each table value in the box above the corresponding value at the bottom of the page. Make a histogram for each set of data. 14 Test Scores 75 29 94 83 12 86 10 163 84 88 NFrequency Score Tally Frequency Percent 41-50 I(P) 2/ 404 51-60 (A ) 61-70 ( ) 75 1 3140 (E) 0715 71-80 (E) (A) 3125 12/410 81-90 ( T ) TO ( H) 025 10 /400 91-100 (A ) 51-60 61-70 81-90 71-80 41-50 91-100 Score 40 Student Foot Lengths (mm) Length |Frequency Percent 181-190 30 12 (L ) 191-200 32 (T) 201-210 28 ( Y ) Frequency 211-220 36 (C) 20 221-230 40 ( H ) 231-240 26 (S ) 241-250 17 (H) 10 251-260 9 ( F ) O 181-190 191-200 241-250 251-260 211-220 221-230 71 201-210 231-240 Foot Length 32.5% 17.5% 12.5% 25% 14% 20% LO 4.5% 8.5% 13% 5% 7.5% 18% 16% 6% CC-62
Step by Step Solution
There are 3 Steps involved in it

Get step-by-step solutions from verified subject matter experts