

Question: What I need: 1- Problem statement (from customer point of view) 2- Opportunity statement (from customer point of view) 3- Prioritized solutions 4- Assumptions and
What I need:
1- Problem statement (from customer point of view)
2- Opportunity statement (from customer point of view)
3- Prioritized solutions
4- Assumptions and additional investigation required
A cohesive VSM analysis report using the PowerPoint template provided, including references used.
This Learning Activity will set you up for success for the group project and final exam.
The Case
As junior Lean Consultants at a boutique management consulting firm, you have been tasked with analyzing two (2) value stream maps and developing an action plan for the Senior Lean Consultant to review prior to meeting with the client.
The Value Stream Mapping sessions were conducted by Lean teams in the respective client organizations (A warehouse and a Financial Institution) and led by another junior Lean consultant from your firm, who has left unexpectedly.
Picking up where that consultant left off, you will need to:
- analyze the value stream maps
- determine the main problem
- create an opportunity statement for each project
- develop a prioritized list of improvements/solutions
- note assumptions and items needing further investigation
- Top marks (promotion!) will go to those Lean Consultants who can quantify their improvements!
- Write an impactful conclusion to demonstrate to the senior consultant that you will be able to guide the organization Lean team to achieve outstanding results in their improvement efforts!
- Compare and contrast the similarities/differences between each value stream. Was the analysis different? Were different tools used? Why or Why not?
Refer to the Guided Readings on Blackboard for Chapter 9 Mapping and Analysis (week 3). The most important aspect of this assignment is to develop Clear Problem/opportunity statements. Without a solid, SMART opportunity statement, the prioritized list of solutions will not deliver the results that the CEO of the organization is looking for.
Like the A3 learning activity, and as is typical in business/industry, you are not given all the necessary information up front. You may need to make assumptions as you do not have all the information. You may decide that there are aspects to this value stream that need further investigation. Rememberit is not always possible to get ALL the information prior to making a decision, so be cognizant about how much investigation will be needed. Any items needing further investigation or assumptions should be noted in your VSM analysis report.
Refer to the Guided Readings in week 4, Chapter 17 Lean Beyond the Factory Floor (week 4). Do you agree/disagree with Vargo and Lusch (p. 307)? Did the lean tools and techniques need to be adapted for the different value streams?
Instructions
- 1. Form a Lean Team of 2 students.
- 2. Signup to a Group on Blackboard (Groups on the left-hand side of Blackboard, using the Groups entitled Learning Activity Week 4 VSM Analysis).
- 3. Read the Learning Activity Instructions and review the two (2) Value Streams provided.
- 4. As a team, decide who will be analyzing which Value Stream. Each student must analyze 1 value stream map alone and note their name
- 5. Read or reread Chapter 9 Mapping and Analysis p. 153 to 163 of the textbook. Attending the lecture in week 3 will be extremely helpful for this learning activity.
- 6. Individually, each student in the pair analyzes one of the Value Stream Maps and completes their section of the PowerPoint template.
- 7. Review each others work. Remember Lean is about collaboration! No ONE person can do Leanit takes a team. Once you have completed your analysis of a value stream map share it with your Lean teammates.
- 8. Meet as a team to share ideas, findings and discuss approach. How can you improve on the analysis that was completed individually?
- Review the problem statement. Is it stated in terms of the customer?
- Review the opportunity statement. Is it SMART? Did you write the statement from the perspective of the customer?
- Review the prioritized list of improvements. Do you all agree? In comparing the analysis across the 2 value streams, what ideas can be added to the other value streams?
- Are you able to set new KPIs or targets? Can you quantify how the improvement will improve the process?
- Write a point form impactful Conclusion based up your analysis.
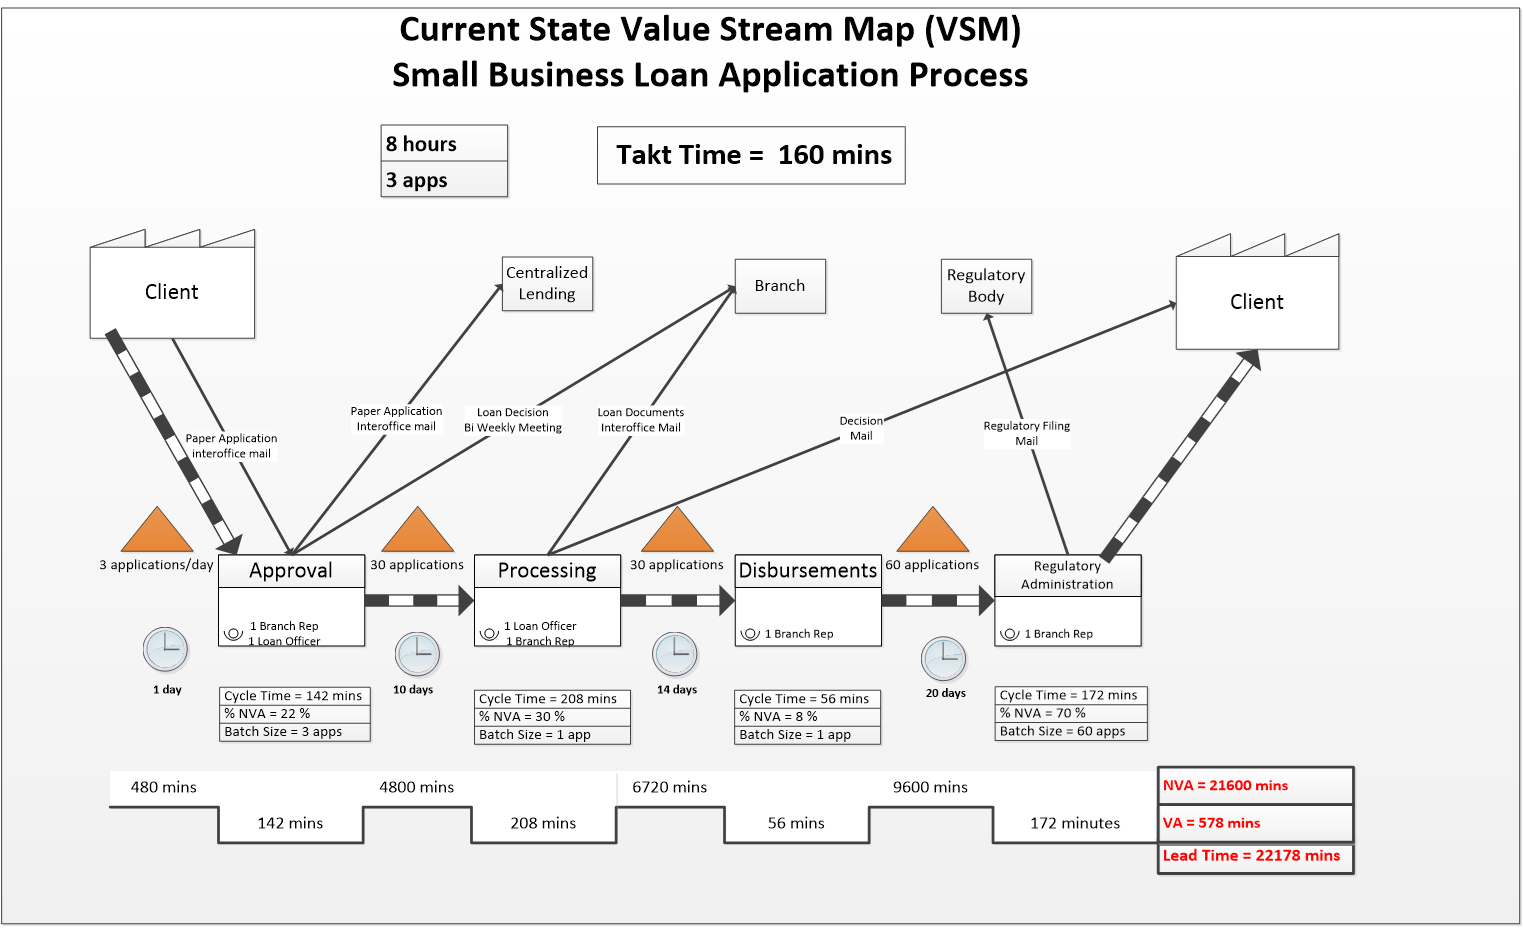
Current State Value Stream Map (VSM) Small Business Loan Application Process 8 hours Takt Time = 160 mins 3 apps Client Centralized Lending Branch Regulatory Body Client Paper Application Interoffice mail Loan Decision BI Weekly Meeting Loan Documents Interoffice Mail Decision Mail Regulatory Filing Mail Paper Application interoffice mail 3 applications/day Approval 30 applications Processing 30 applications Disbursements to applications Regulatory Administration 1 Branch Rep 1 Loan Officer 1 Loan Officer 0 1 Branch Rep O 1 Branch Rep O 1 Branch Rep 1 day 10 days 14 days 20 days Cycle Time = 142 mins % NVA = 22 % Batch Size = 3 apps Cycle Time = 208 mins % NVA = 30 % Batch Size = 1 app Cycle Time - 56 mins % NVA = 8% Batch Size = 1 app Cycle Time = 172 mins % NVA = 70 % Batch Size = 60 apps 480 mins 4800 mins 6720 mins 9600 mins NVA = 21600 mins 142 mins 208 mins 56 mins 172 minutes VA = 578 mins Lead Time = 22178 mins Current State Value Stream Map (VSM) Small Business Loan Application Process 8 hours Takt Time = 160 mins 3 apps Client Centralized Lending Branch Regulatory Body Client Paper Application Interoffice mail Loan Decision BI Weekly Meeting Loan Documents Interoffice Mail Decision Mail Regulatory Filing Mail Paper Application interoffice mail 3 applications/day Approval 30 applications Processing 30 applications Disbursements to applications Regulatory Administration 1 Branch Rep 1 Loan Officer 1 Loan Officer 0 1 Branch Rep O 1 Branch Rep O 1 Branch Rep 1 day 10 days 14 days 20 days Cycle Time = 142 mins % NVA = 22 % Batch Size = 3 apps Cycle Time = 208 mins % NVA = 30 % Batch Size = 1 app Cycle Time - 56 mins % NVA = 8% Batch Size = 1 app Cycle Time = 172 mins % NVA = 70 % Batch Size = 60 apps 480 mins 4800 mins 6720 mins 9600 mins NVA = 21600 mins 142 mins 208 mins 56 mins 172 minutes VA = 578 mins Lead Time = 22178 mins
Step by Step Solution
There are 3 Steps involved in it

Get step-by-step solutions from verified subject matter experts